
The tech-heavy Nasdaq 100 index is doing very well so far this year – up 22.4 percent. This compares with a rise of 10.3 percent for the Dow Industrials, 10.1 percent for the S&P 500 large cap index, and a mere 3.3 percent for the Russell 2000 small cap index.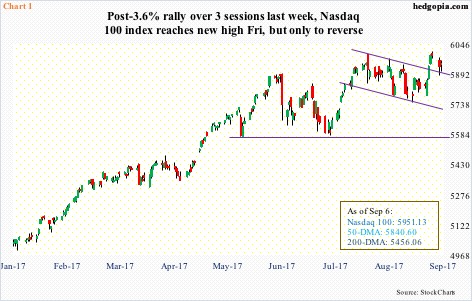
Last Friday, the Nasdaq 100 (5951.13) rose to a new intraday high of 6009.61, but only to give back the gains by close (Chart 1). This, however, preceded a 3.6-percent rally from intraday low to high over three sessions.
The index is in the process of digesting those gains, and odds favor it continues to come under pressure – at least near term. The daily chart is overbought.
Nearest support lies at 5780, followed by 5580, and then 5450. The latter approximates the 200-day moving average.
The bigger question is, is the Nasdaq 100’s outperformance supported by fundamentals? This is where things get a little iffy.
U.S. business capital expenditures are hardly booming.
Orders for non-defense capital goods ex-aircraft – proxy for business capex – rose 3.9 percent year-over-year in July to a seasonally adjusted annual rate of $64.1 billion. This is the sixth consecutive y/y increase, but growth has decelerated from May’s 6.1 percent (Chart 2). Importantly, orders peaked in September 2014 at $70.3 billion.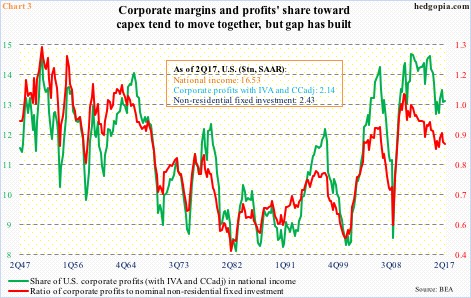
Chart 3 looks at the same issue but with a different twist.
In it, U.S. corporate margins are plotted against a ratio between corporate profits and nominal non-residential fixed investment.
Profits adjusted for inventory valuation and capital consumption were up 1.3 percent quarter-over-quarter in 2Q17 to $2.14 trillion (SAAR). They peaked in 4Q14 at $2.23 trillion.
The green line in the chart is profits’ share in national income – a proxy for margins. Historically, it tends to move in tandem with the red line. The last time corporations spent more in capex than took in profits was five years ago. More importantly, the gap between the two lines is widening.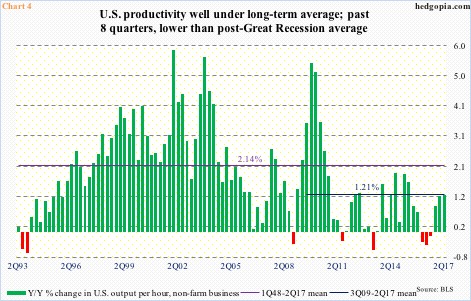
This has repercussions for productivity.
Post-Great Recession, particularly beginning 2011, U.S. output per hour has been lackluster – to say the least.
Going all the way back to 1Q48, productivity has grown y/y at an average 2.14 percent. In the current recovery, this has been reduced to a paltry 1.21 percent. This is despite the fact that in the first six quarters, productivity was very healthy, then it fell apart (Chart 4).
In 2Q17, productivity rose 1.19 percent. This was the highest in the past eight quarters, three of which were negative. (Revised 2Q17 numbers come out later this morning.)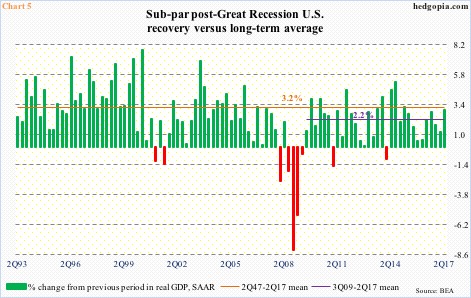
This, in turn, has a bearing on GDP.
Growth in real GDP in 2Q17 was recently revised higher to three percent. This was also the highest growth rate in nine quarters. Post-Great Recession, growth has averaged 2.2 percent, much weaker than the long-term average of 3.2 percent going back to 2Q47 (Chart 5).
The share of non-residential fixed investment in nominal GDP itself peaked in 3Q14 at 13.1 percent, with 2Q17 at 12.7 percent.
Within the non-residential fixed investment line item – $2.43 trillion in 2Q17 (SAAR) – structures were $561.9 billion, equipment $1.08 trillion and intellectual property products $790.4 billion. Tech outfits are particularly exposed to the latter two, hence the role of capex in their business.
That said, as far as tech stocks go, subdued capex/productivity/GDP has not mattered. As mentioned earlier, the Nasdaq 100 leads its major U.S. peers by a wide margin.
With this, technicals have increasingly diverged with fundamentals. The longer this goes on, the higher the odds/risk that in due course the former follows the latter.
Thanks for reading!
