
March-quarter earnings, which are on the home stretch, are raising questions – most prominently as to where the sell-side says things are headed and where they might in fact be headed.
As of last Tuesday, 89.4 percent of S&P 500 companies reported their March quarter; 76.4 percent of these beat, which is the highest beat percentage in a year.
Of course, going into the reporting season, the sell-side had lowered the bar enough that jumping over the hurdle was rendered easy.
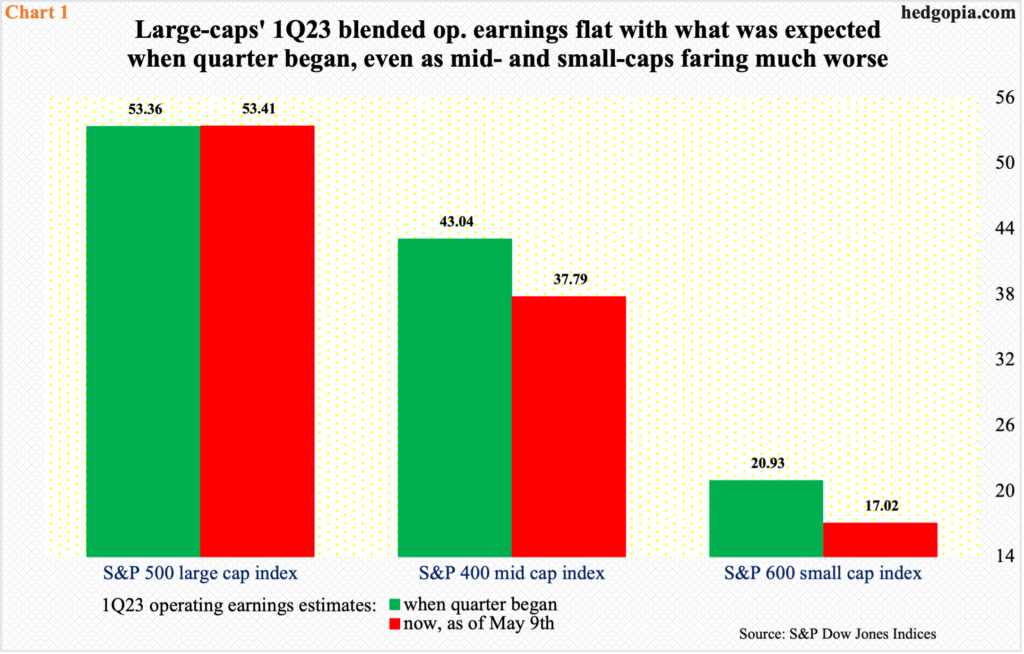
When 1Q23 began – or when 4Q22 ended – they were expected to earn $53.36 in operations, which as of April 5 was revised lower to $50.03. Five weeks later, as of May 9, the blended earnings have come in at $53.41, which is slightly more than what they were expected to make at the beginning of the quarter. Unfortunately, the same does not apply to the mid- and small-caps (Chart 1).
In the case of the mid-cap S&P 400 companies, they have so far rung up $37.79, which is substantially smaller than the $43.04 expected when 1Q began. And the small-cap S&P 600 companies have earned $17.02, versus the $20.93 consensus when 4Q22 ended.
Just focusing on the large-caps to draw a conclusion about how earnings fared in 1Q is misleading. This is particularly so considering that the small-caps in particular are the ones with a large exposure to the domestic economy, and they are the ones that more often than not are used to take the economic pulse.
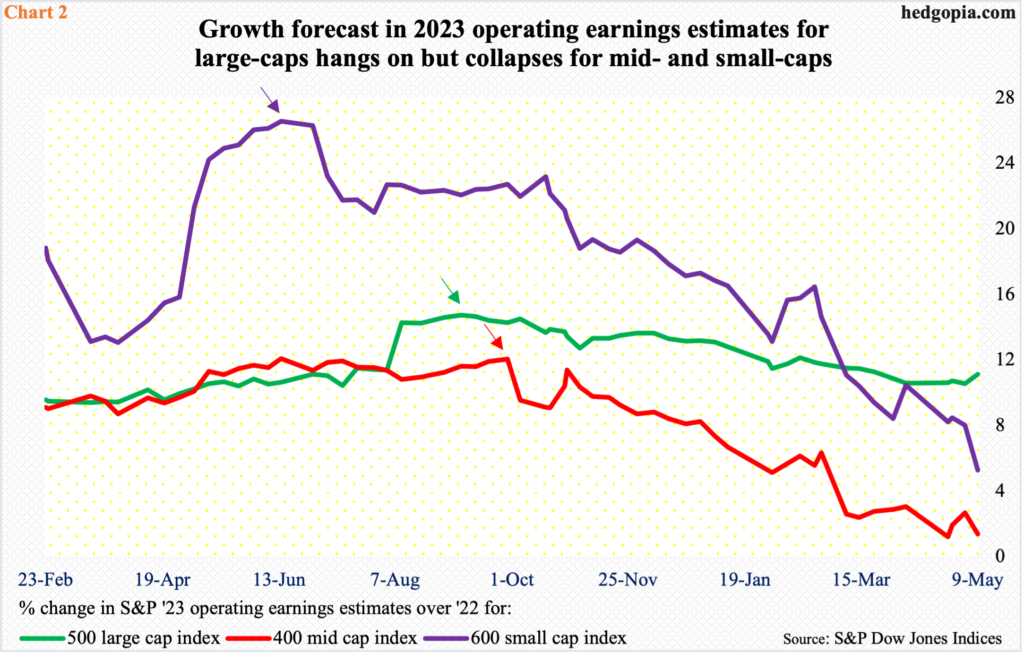
For this year, S&P 600 estimates have been persistently cut lower, with operating earnings now expected to grow 5.3 percent over 2022. As of June 14 last year, 2023 earnings were expected to jump 26.6 percent (indigo arrow in Chart 2).
Mid-caps, in this regard, are faring no better. Earnings this year are now expected to only grow 1.4 percent. At September 29 last year, the sell-side had priced in growth of 12.1 percent (red arrow).
Large-caps are the exception. As of last Tuesday, earnings are expected to grow 11.1 percent, which is respectable. Even here, as of September 7 last year, the consensus was for growth of 14.7 percent (green arrow). Regardless, growth expectations are holding up better for large-caps versus mid- to small-caps.
Overall, growth expectations once again are rosy for next year. For small- and mid-caps, 2023 earnings are expected to grow 25.5 percent and 15.8 percent respectively. These growth rates incidentally are similar to how 2023 was expected to grow at the peak last year.
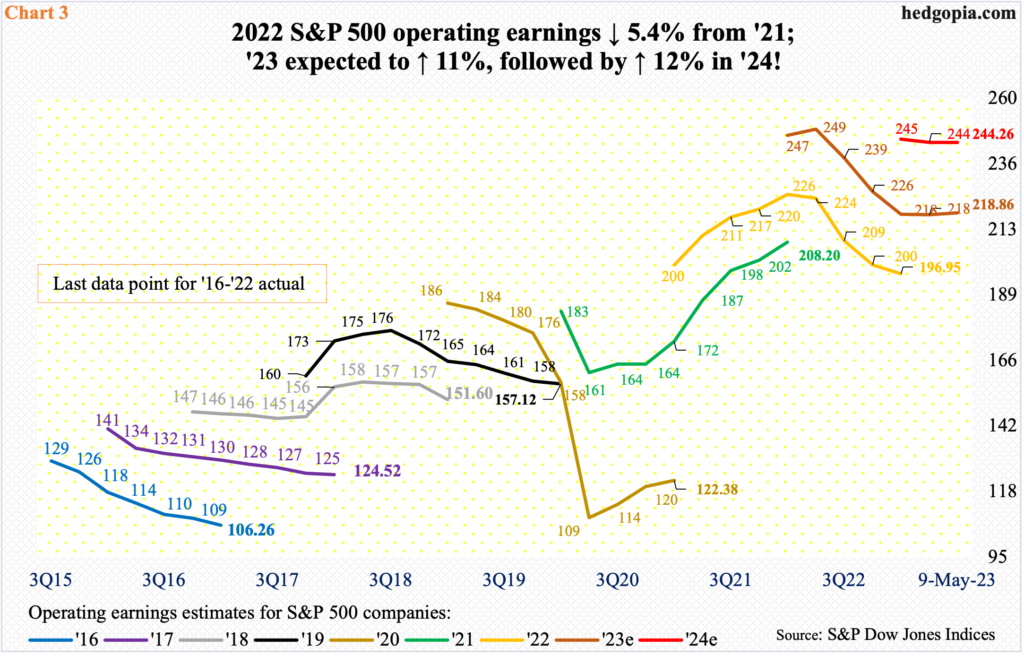
In 2023, for instance, S&P 500 companies were expected to bring home $250.12 as of April 27 last year; this has now been revised lower to $218.86. Similarly, 2022 was at $227.51 as of April 27 (last year); when it was also said and done, $196.95 was rung up (Chart 3).
Similarly, peak 2022 expectations were $186.81 as of May 18 last year for the mid-caps and $92.70 as of April 22 last year for the small-caps, but only to actually earn $169.35 and $75.96, in that order.
There is a message in all this.
This often occurs as the sell-side has a habit of starting out optimistic and then bring out the scissors as the year progresses. This complicates the valuation process.
When estimates get revised lower in as big a way as has been the practice, the act of valuing these indices on forward estimates will be off-target – plain and simple.
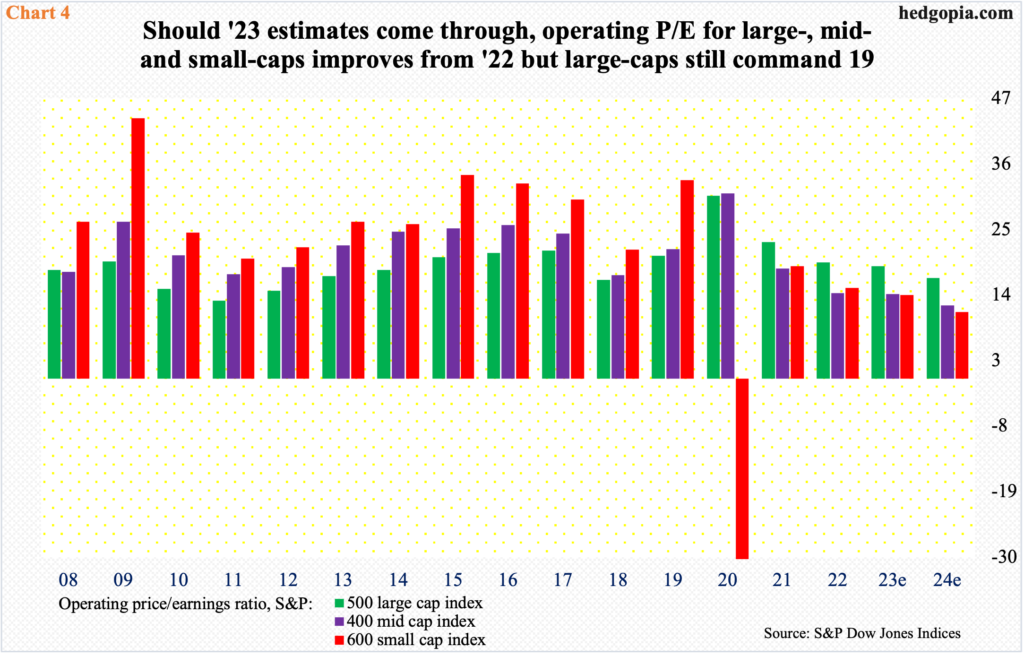
Currently, the operating price-to-earnings ratio for the S&P 500/400/600 on this year’s projected earnings respectively are 18.8x, 14.2x and 14x (Chart 4). First, as far as large-cap investors are concerned, a p/e of nearly 19x is already on the elevated side. Secondly, as estimates get revised lower, the multiple rises.
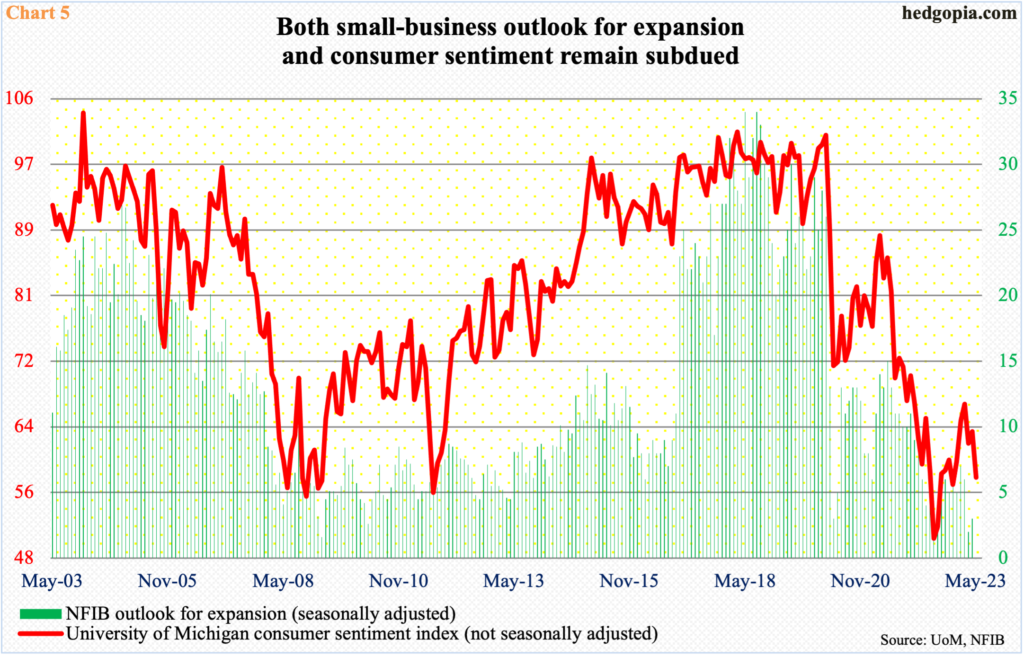
This at a time when consumer and small-business sentiment continue to remain depressed.
May’s preliminary reading showed the University of Michigan’s consumer sentiment index declined 5.8 points month-over-month to 57.7. Last June, the index made a record all-time low of 50 (Chart 5).
Concurrently, the NFIB (National Federation of Independent Business) outlook for expansion sub-index rose a point m/m in April to three, with March’s two matching a low from March 2009.
For optimists, the hope is that these sentiment readings are already so subdued there probably is not much room for deterioration. As relates to the small-business outlook for expansion in particular, the US stock market bottomed in March 2009, with the economy coming out of recession in June that year.
With that said, both 2023 and 2024 earnings estimates face substantial risks of downward revision, and in the long run that is likely to decide investing decisions.
Thanks for reading!
