
As S&P 500 earnings staged massive recovery from post-pandemic lows, buybacks are back in fashion. Thus far in 4Q, the index is already up north of nine percent, pricing in a lot of seasonality optimism. As things stand, the index can break out as easily as break down.
At the then-high 4546 on September 2, the S&P 500 was up as much as 5.8 percent in 3Q21, but a 4.8-percent decline in that month reduced the quarterly increase to a mere 0.2 percent. During July-September, FINRA margin debt contributed nicely, up $21 billion quarter-over-quarter (chart here), and turns out buybacks set a new record. One wonders how the index would have fared if not for all this borrowing/spending.
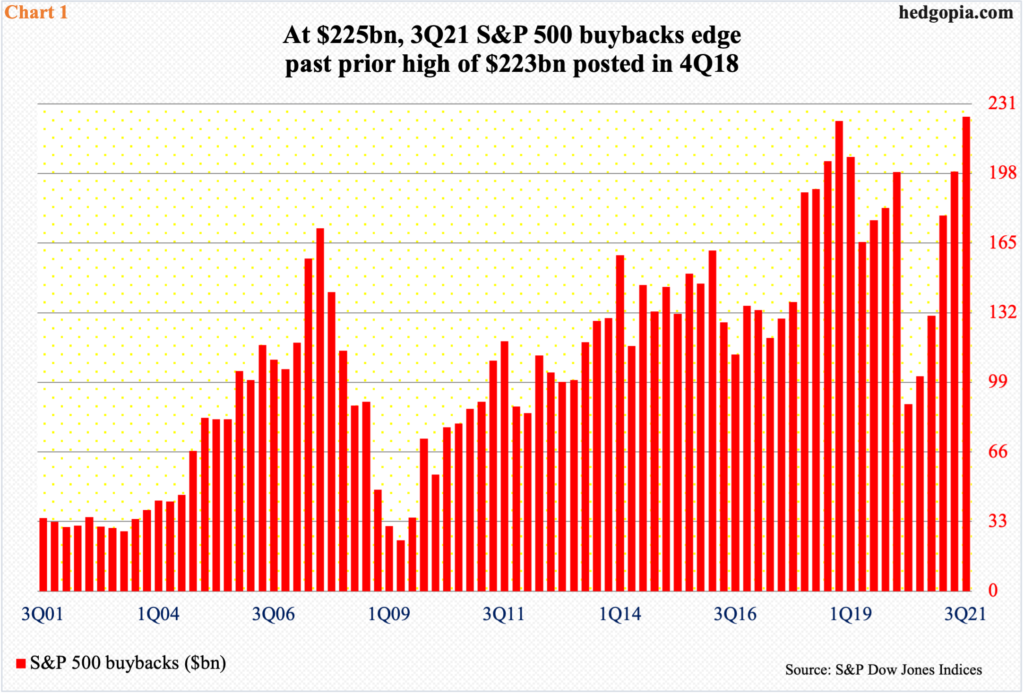
With 95 percent of S&P 500 companies reporting, 3Q21 buybacks were $225 billion, which edged past the prior record of $223 billion posted in 4Q18 (Chart 1). The yearly record of $806.4 billion was recorded in 2018. In the first three quarters this year, buybacks totaled $602 billion, meaning a 4Q total of at least $205 billion will set a new record this year, which is doable. (This is a rough estimate, because as the remaining five percent report, 3Q total will increase, and this will decrease the amount needed in 4Q to exceed the 2018 total.)
But the point is, buybacks have come back with a vengeance. In 2Q20, they dipped as low as $88.7 billion, followed by a q/q increase in each of the subsequent five quarters.
Companies increased buybacks as earnings saw massive improvement in recent quarters. With 88 percent of the results in, blended 3Q21 S&P 500 operating earnings estimates are tracking up 0.4 percent q/q to $52.24. In 2Q, operating earnings totaled $439.8 billion, up from $161.6 billion in 1Q20. In the last six quarters, earnings have more than covered buybacks and dividend payments.
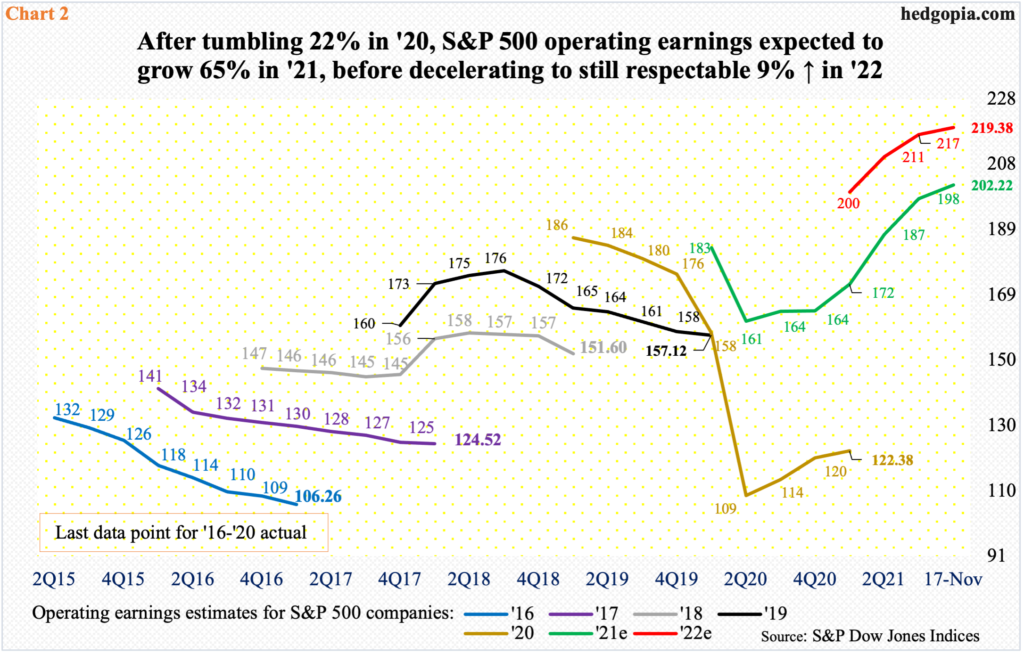
The sell-side expects the earnings momentum to continue next year. This year, as of last Wednesday, S&P 500 companies are set to earn $202.22 in operations, which will have bettered 2020 earnings of $122.38 by 65 percent. Next year, earnings are projected to rise another 8.5 percent to $219.38. The revision trend for both this year and next began to sharply rise early this year and has persisted (Chart 2).
Corporations’ cash pile has also been padded by borrowing. As of 2Q21, non-financial corporate debt stood at $11.2 trillion – a record.
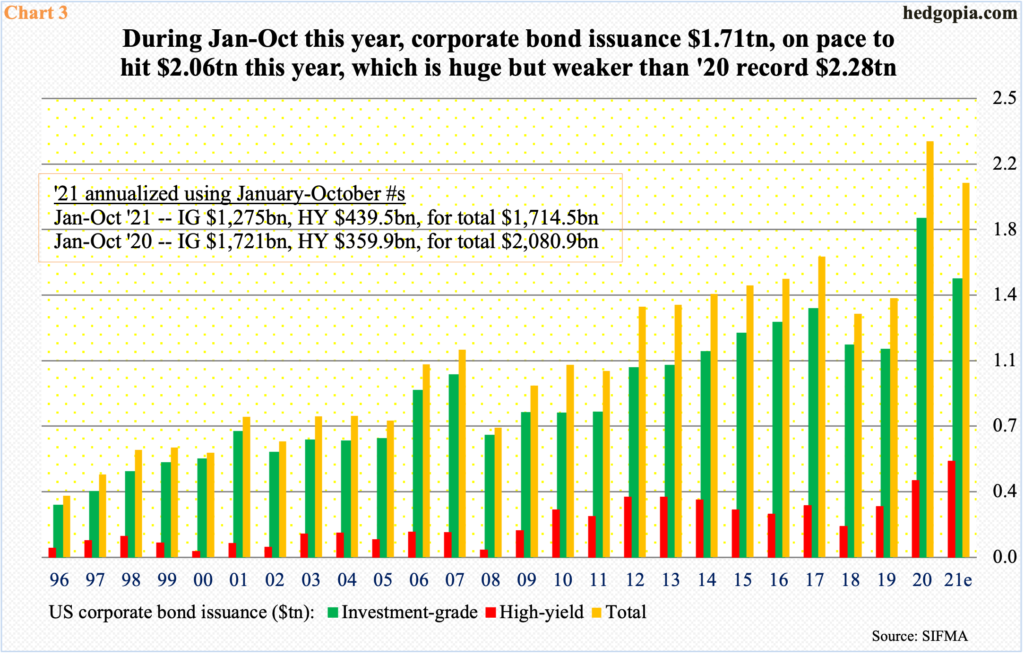
In 2020, US corporations issued $2.3 trillion in bonds, comprised of $1.9 trillion in investment-grade and $422 billion in high-yield, with all three categories setting new records. With 10 months in, these companies have respectively issued $1.7 trillion, $1.3 trillion and $440 billion this year. If momentum persists in the remaining two months, they will have issued $2.1 trillion, $1.5 trillion and $527 billion, in that order (Chart 3). These are massive amounts, with investment-grade and total issuance on course for a slight drop and high-yield set to post another record.
Investor love for high-yield bonds, among others, reflects the prevailing effervescent mood. Major US equity indices are at/near all-time highs.
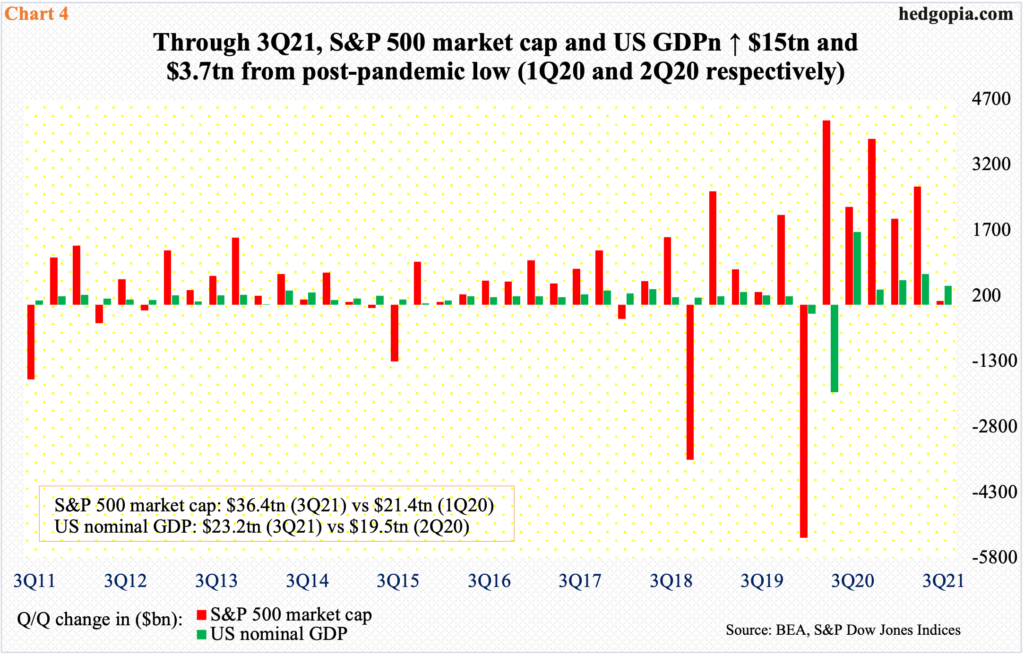
At the end of 3Q21, S&P 500 market cap rose a tad q/q to $36.4 trillion; in comparison, nominal GDP reached $23.2 trillion. From the 2Q20 low of $19.5 trillion, the economy grew $3.7 trillion through 3Q21. The S&P 500 reached a major low in 1Q21 and is up $15 trillion (Chart 4). Thus far in 4Q, the index is up another 9.1 percent. This will have further pushed the ratio of total market cap to GDP – also known as the Buffet Indicator – to record territory.

An equivalent way of looking at things is the price-to-sales ratio.
In 2Q21, the four-quarter total of S&P 500 sales reached $1,463, resulting in a record ratio of 2.94x. In 3Q21, sales hit $1,511, even as the index meekly edged up 0.2 percent; as a result, the ratio dropped slightly to 2.85x (Chart 5). But unless the S&P suffers a nasty downtrend in the remaining six weeks, the ratio is all set to post another high in 4Q.
The large cap index currently sits at a crucial juncture.
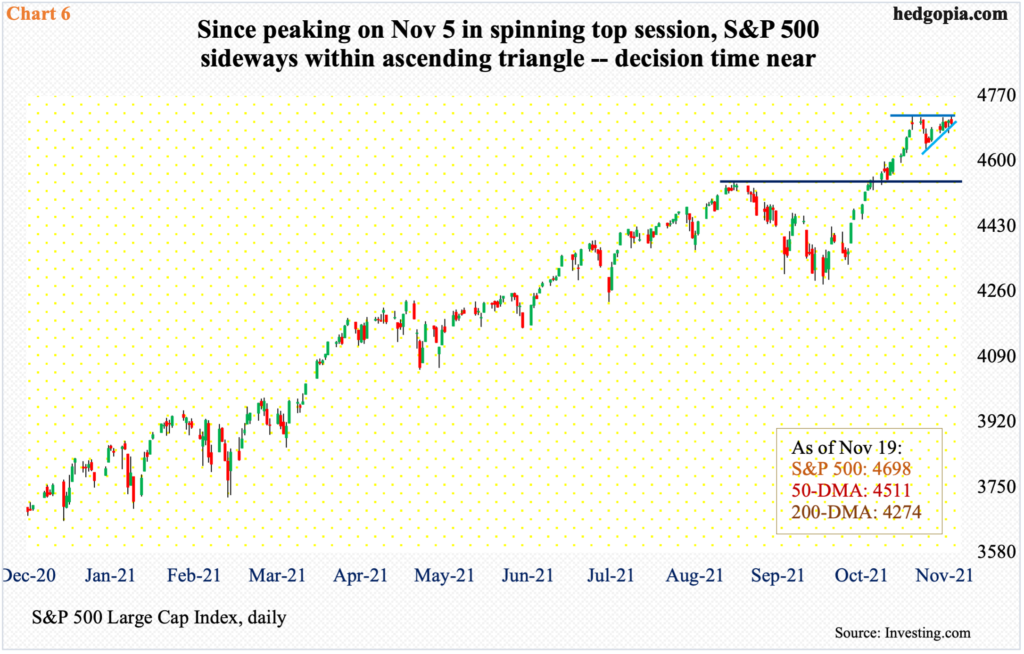
This time of the year, seasonality tends to favor the bulls. As mentioned earlier, the S&P 500 is already up 9.1 percent in the current quarter. A lot of optimism is baked in. Just in a month through the November 5 high of 4719, it jumped 10.2 percent. From that spinning top high, the index (4698) has essentially gone sideways within an ascending triangle (Chart 6). This pattern tends to be bullish, but you never know.
The S&P 500 would break out at 4710s but can equally break down at 4700. A decision time is near. In the first hour last Thursday, it came close to falling out of the triangle but was saved by close. Come Friday, bulls again tried to stage a breakout, coming less than a point within the November 5 high but were rejected.
Either way it breaks, momentum likely follows – at least near term. This week’s action is crucial. A breakdown can quickly set in motion a self-fulfilling prophecy, as the recent longs that built positions hoping for favorable seasonality cash in their gains.
Thanks for reading!
