
The Nasdaq 100 continues to lag, while the Russell 2000 last week followed on the footsteps of the S&P 500 with a breakout of its own. Bearish investor sentiment in the meantime is hitting lows that in the past marked a reversal.
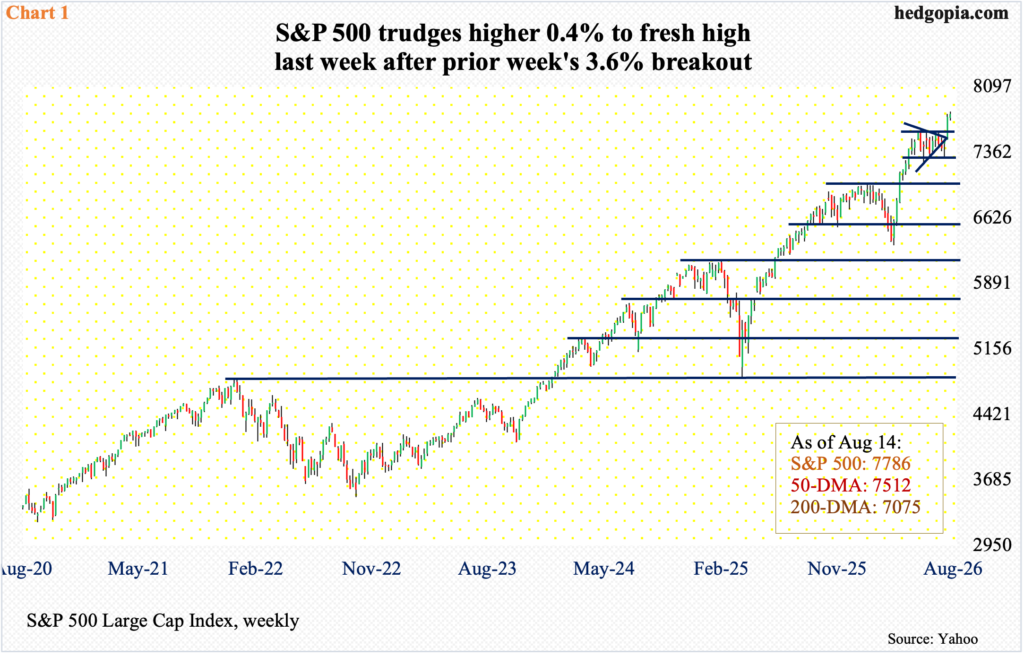
Equity bulls built on the prior week’s 3.6-percent breakout on the S&P 500 by adding a subdued 0.4 percent last week to 7786, with an intraday high of 7817 recorded on Thursday.
Two weeks ago, the large cap index broke out of a two-month consolidation phase that began after peaking at 7621 on June 2; down below, bids repeatedly showed up at 7300s. Using a measured-move approach, technically oriented bulls could be targeting north of 7900.
For this scenario to pan out, bulls must defend near-term horizontal support at 7760s. Inability to do so will give the bears a chance to push the index toward a breakout retest of 7600 (Chart 1).
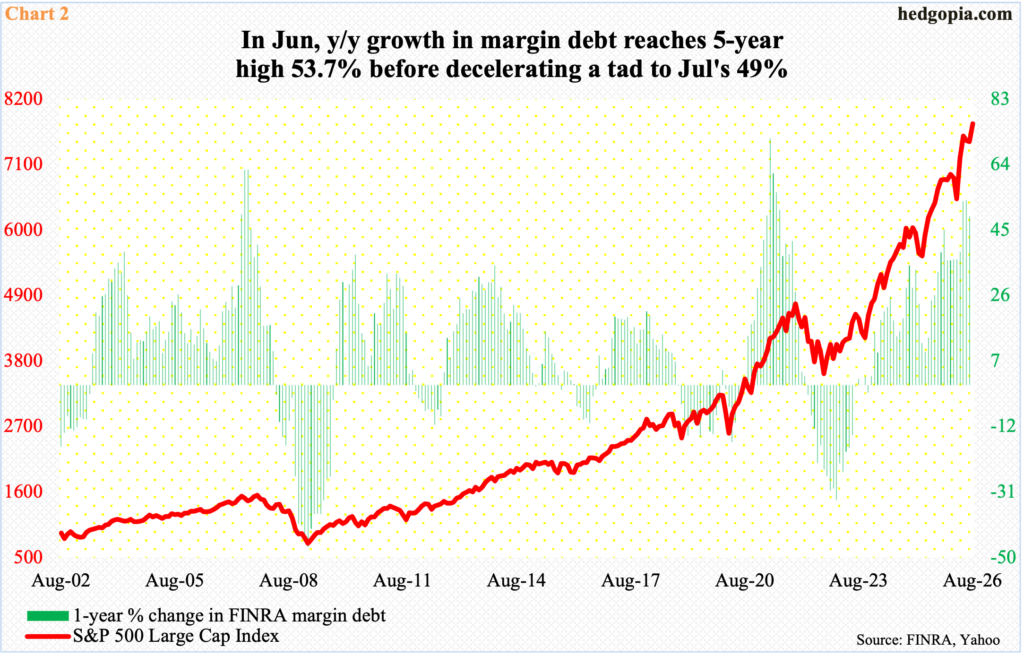
Leverage continues to cooperate with the bulls. In July, FINRA margin debt dropped $84.8 billion to $1.42 trillion but June’s $1.5 trillion was a record. From March’s $1.22 trillion, margin debt jumped $281.2 billion over three months.
US equities bottomed in March. Going back further, they reached a major low in April last year when margin debt troughed at $850.6 billion; from a year ago, it bottomed at growth of 9.7 percent in May. Momentum continued to build, reaching a five-year high of 53.7 percent in June this year, before decelerating a tad to July’s 49 percent (Chart 2). The gradual build-up in margin debt momentum is well reflected in the S&P 500, and other indices.
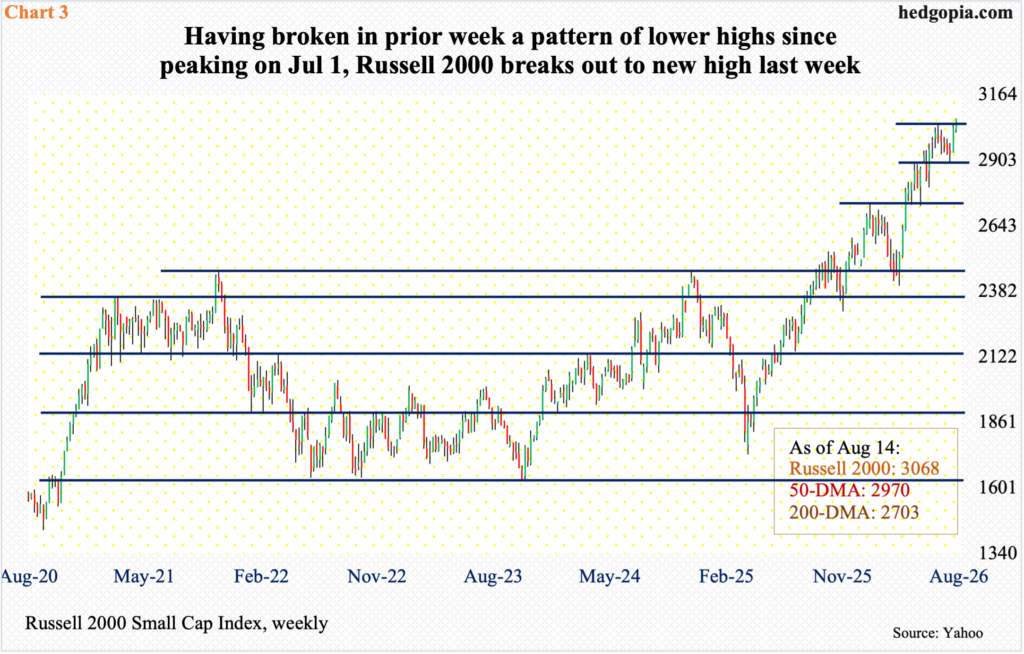
Of the major US equity indices, margin debt has the tightest correlation with the Russell 2000, and it has benefited.
Last week, on the heels of the prior week’s breakout in the S&P 500, the small cap index broke out – albeit barely – to 3068, with a fresh intraday high of 3070 tagged on Friday. Earlier, the Russell 2000 came under pressure for four consecutive weeks with a pattern of lower highs after tagging 3047 on July 1, which was then surpassed on the 5th this month by ticking 3049 (Chart 3).
In the sessions ahead, hence, 3040s hold importance, and this needs to hold. Else, it does not take long before the index gravitates toward 2940s, and 2880s after that.
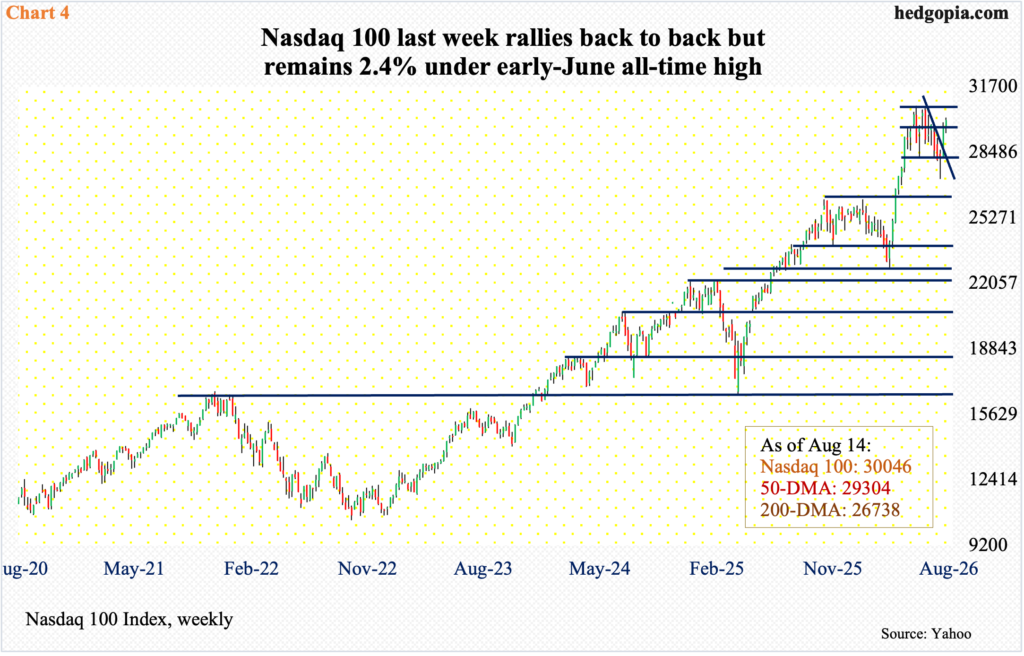
The tech-heavy Nasdaq 100 in the meantime is lagging – at least from the performance point of view. Last week, it rose 1.1 percent to 30046 but remains 2.4 percent below the June 3 peak of 30762.
To be clear, the Nasdaq 100 shot up 34.7 percent from the March 30 low 22841 to the June high. It is entirely possible these gains are being digested. The S&P 500 itself went sideways for a couple of months before breaking out two weeks ago.
That said, one gets a sense that tech is beginning to trade differently. Nvidia (NVDA) reports its July quarter on Wednesday next week, and a lot is riding on these results. For their part, tech bulls will be trying to build on the prior week’s decisive break out of trendline resistance from the early-June high (Chart 4).
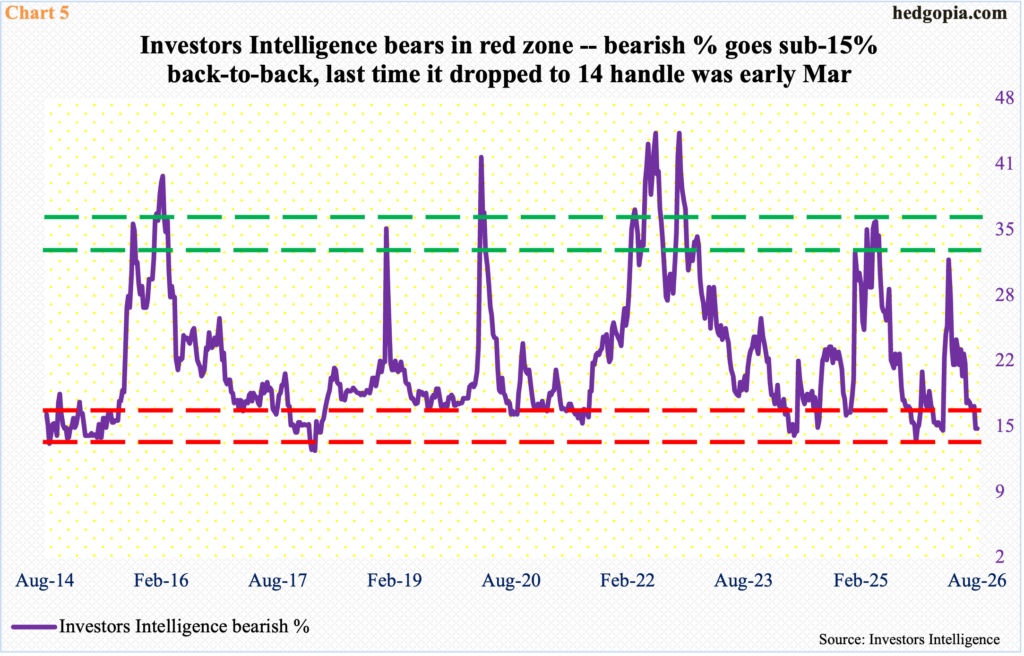
Tech’s inability to rally to a new high comes at a time when investor sentiment is perking along. As of Tuesday last week, Investors Intelligence’s bullish percent increased 3.7 percentage points week over week to 57.4 percent, which set a six-month high; the bearish percent meanwhile was unchanged at 14.8 percent.
Bears are increasingly getting scarce. The August 11 reading is the lowest since the March 3 low of 14.6 percent. Bearish sentiment has gotten very low, as it has entered the red zone (Chart 5). If past is prologue, it is precisely when there is almost no one left to be a bear does sentiment tends to reverse to the other side.
Investor sentiment is running counter to consumer sentiment which remains very subdued. August’s preliminary reading showed that the University of Michigan’s consumer sentiment index dropped 4.2 points month over month to 51, with the all-time low of 44.8 having been recorded in May.
The gloomy consumer sentiment also does not jibe with retail sales near record territory. July sales were down 0.6 percent m/m to a seasonally adjusted annual rate of $763.6 billion, but June’s $768.1 billion was a record.
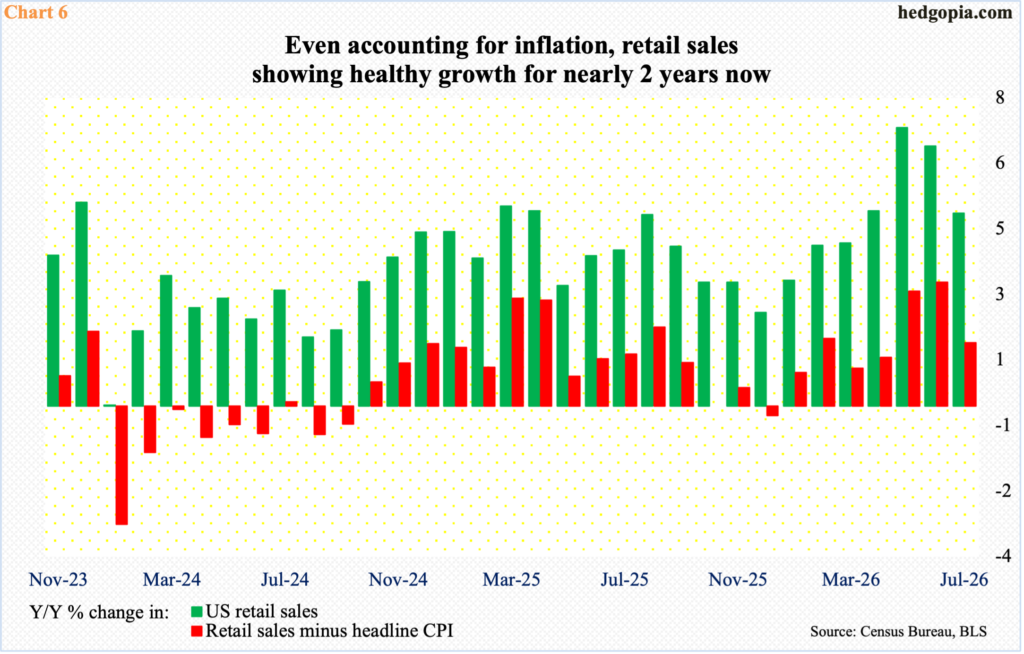
Even accounting for inflation, retail sales are putting up healthy numbers. In July, sales grew five percent year over year; using the 3.4-percent rise in headline CPI (consumer price index) to adjust these numbers, retail sales still grew 1.4 percent.
As a matter of fact, except for negative y/y growth of 0.2 percent last December, real retail sales have not had a negative month in 22 months (Chart 6). Equities right here and now are paying attention to this metric more than the consumer sentiment data; bulls have behaved this way for a while now, even as bears are disappearing fast. Contrarians should treat this as a time not to celebrate rather to take out their cautionary hat.
Thanks for reading!
