
The S&P 500 hurriedly jumped 6.4 percent in seven sessions. Impatient bulls essentially handed out shorts an opportunity to once again show up at 2800. The risk is the downside, but it is likely 2800-2600 remains intact in the next several sessions.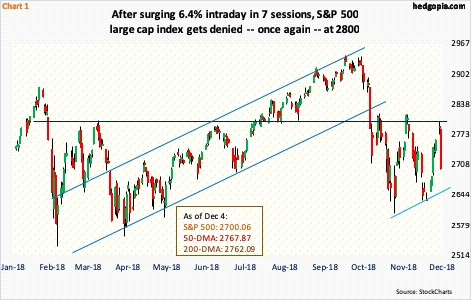
Tuesday’s trading in which the 3.2-percent drop in the S&P 500 large cap index essentially came out of nowhere probably suggests that (1) short-covering helped in last week’s rally, and (2) bears have matters under control. The dynamics can change anytime but for that bulls need to step up, provided they have the wherewithal.
Last week, they gave it a try. Having defended in the prior week the lows of October, come Wednesday they latched onto the supposed dovish switch by Jerome Powell, Fed chair. The S&P 500 jumped 4.9 percent for the week. This probably caused shorts to cover (more here).
Then came last weekend’s trade truce reached between the US and China at the G-20 meeting in Argentina. Monday, the S&P 500 rallied 1.1 percent – in fact, it was up as much as 1.5 percent intraday. Once again, shorts likely caved in, at least initially. But they possess the ball. They have had it since at least early October.
Monday, the S&P 500 rallied alright, but the session produced a long-legged doji just above the 50- and 200-day moving averages. This was preceded by a 6.4-percent jump intraday in seven sessions. Bears showed up right where they were expected to. Since the S&P 500 sold off in January-February this year, 2800 has proven significant, including mid-October and early last month. On both those occasions, selling accelerated at that level (Chart 1).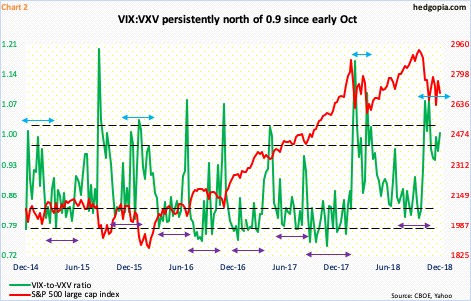
There is a slight change in the character of bull-bear dynamics. Buy-the-dip mentality, which was otherwise pervasive, has ceased to work this year. Pretty much. Things have been volatile enough for nimble traders to potentially do well, but not passive longs.
Amidst this back-and-forth, particularly since early October, volatility has sustained at a higher level. In the past nine weeks, the ratio of VIX, which measures market’s expectation of 30-day forward volatility using S&P 500 options, to VXV, which does the same but goes out to three months, has persistently remained north of .9. It closed Tuesday at one.
Several times in the past, VIX:VXV went sideways at/near oversold territory, which meant VIX persistently stayed low (violet bi-directional arrows in Chart 2). This time around, it has remained overbought for weeks now.
Markets are in a de-risking mode, looking for a reason to sell. Tuesday’s tumble supposedly was ignited by concerns over US-China trade as well as global growth. The persistently flattening Treasury yield curve did not help.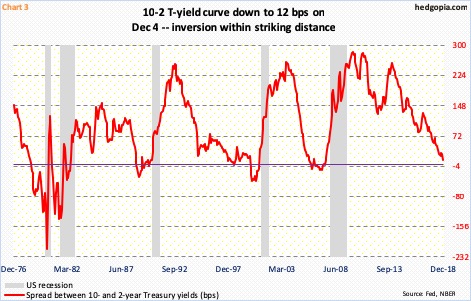
The spread between Treasury 10- and two-year yields have been declining since peaking in December 2013 at 256 basis points (Chart 3). Tuesday, this had narrowed to merely 12 basis points.
Two-year yields tend to be sensitive to expectations of the Fed’s monetary policy. Since December 2015, the fed funds has gone up by 200 basis points to a range of 200 to 225 basis points. The fed raised three times this year, and a hike in December (18-19) is imminent. The 10-year yield in the meantime rose as high as 3.25 percent on October 5, but it has struggled to follow short rates higher. Tuesday, it fell as low as 2.89 percent intraday, before closing at 2.92 percent. At this rate, inversion is just a matter. The long end is clearly warning the Fed not to get too tight, or else.
Thus the uncertainty surrounding US stocks. Favorable seasonality or not, choppiness is the path of least resistance. If anything, the risk is to the downside in the next several sessions.
On the daily chart, the S&P 500 (2700.06) is overbought. In the very near term, shorts can appear at 2724, which is where the 20-day lies, even as longs can show up at 2650, which represents a rising trend line from early October. Going further out, there is resistance at 2800 and support at 2600. This also creates an opportunity to play a range.
SPY December 14th iron butterfly:
- Buy 281 call at $0.44
- Sell 271 call at $3.75
- Sell 271 put at $4.22
- Buy 261 put at $1.37
SPY (SPDR S&P 500 ETF) closed Tuesday at $270.25. An iron butterfly trade may be brewing. An iron butterfly is essentially a straddle with defined risk, hence margin requirement will be a lot less than a straight straddle. It combines a short straddle with a long strangle. Another way to look at this is it is a combination of a bear call spread with a bull put spread.
Hypothetically, a December 24th 281/271/261 iron butterfly earns a credit of $6.16. It is a 10-point spread, so $3.84 is at risk. Breakeven points are $277.16 and $264.84.
Thanks for reading!
