
One of the knocks on the rally that began on September 29th is that it is primarily led by large-caps.
From that low through most recent highs, the S&P 500 large cap index rallied 13.1 percent, and the Nasdaq 100 index 16 percent. In contrast, the S&P 400 mid cap index rose 9.5 percent, and the Russell 2000 small cap index 11.3 percent.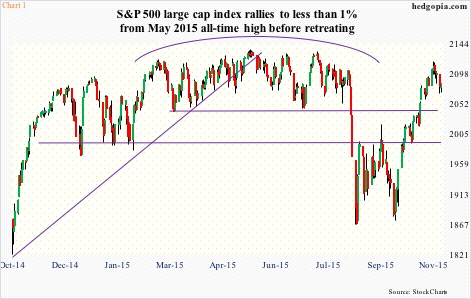
Before it started retreating on the 3rd this month, the S&P 500 was a hair’s breadth away – 0.9 percent, to be exact – from the all-time high it reached in May this year (Chart 1).
The Nasdaq 100 one-upped the S&P 500 – up 25 percent since the August low to reach an all-time high (Chart 2).
Throughout this, the Russell 2000 struggled at 1170 (Chart 3), and the S&P 400 at 1440 (Chart 4).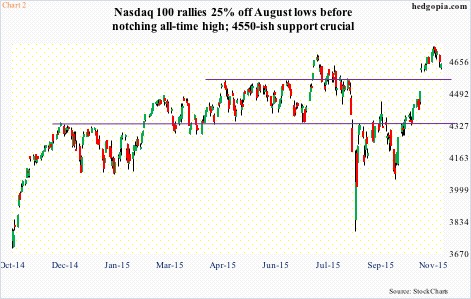
Even within the Nasdaq 100, the larger of the large-caps are doing the heavy lifting. Last week, on its way to notching a new high the index rallied 1.3 percent. The top-five holdings all contributed heavily – AAPL (13 percent weight) up 1.7 percent, MSFT (7.4 percent weight) up 4.3 percent, AMZN (5.1 percent weight) up 5.4 percent, GOOGL (4.5 percent weight) up 3.3 percent, and FB (4.3 percent weight) up five percent.
Too big a reliance on a limited number of names narrows the breadth – never healthy from the overall health perspective.
So when the Russell 2000 and the S&P 400 staged a breakout on the 28th last month, it obviously ignited a lot of talk about this belatedly confirming the strength in large-caps.
It wouldn’t be such a bad thing if money came out of hitherto leaders and moved into the laggards.
But is it too early to declare victory?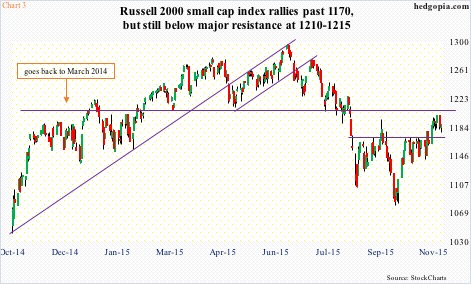
After that breakout on the 28th, the S&P 400 proceeded to test resistance at a higher level – 1455-ish – but was unable to hold it (Chart 4). The good thing is that buyers did show up yesterday to defend 1440, which also approximates the 20-day moving average.
On the Russell 2000, after breaking out of 1170, it lacked the momentum to go test the all-important resistance at 1210-1215 (Chart 3). It is yet to test support at 1170. And that probably needs to happen for its own health. This level also approximates the 20-day moving average, hence may not give in that easy.
But here is the risk.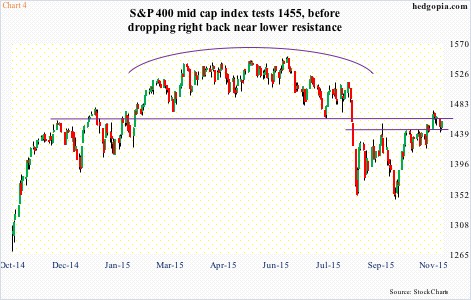
Unless the Russell 2000 regains strength and marches toward and ultimately beyond 1210-1215, the longer it lingers around here, the higher the odds that shorter-term moving averages will begin to roll over. Even the 50-day moving average is no longer rising as fast as it was just a few sessions ago, and looks to be wanting to go flat.
Should that happen, it would have come in the midst of overbought daily conditions. Hence the importance of 1170, and bulls’ need to defend that level. If it cannot be saved, and by the time daily overbought conditions get unwound, weekly conditions would probably have turned down.
That would be a bad development, since, as things stand now, there is room for weekly conditions to continue to move higher. If small-cap bulls cannot take advantage of this, that would just be a confirmation that the Russell 2000 was lagging its larger brethren for a reason.
Thanks for reading!
