One of the hallmarks of post-Great Recession recovery has been subdued capital expenditures. In 2Q16, real non-residential fixed investment was $2.19 trillion (at a seasonally adjusted annual rate) – essentially flat since 3Q14. Investment peaked at $2.22 trillion in 3Q15.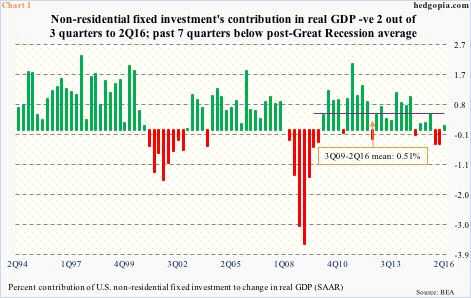
Consequently, non-residential fixed investment has not been a great contributor to real GDP. In 2Q16, it contributed 0.12 percent, but that came on the heels of two successive quarters of negative contribution. Since 3Q09, non-residential fixed investment’s mean contribution has been 0.51 percent, with seven quarters to 2Q16 below that (Chart 1).
One other hallmark of this recovery has been aggressive share buybacks.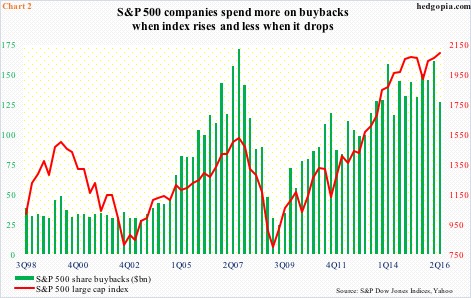
In 2Q16, S&P 500 companies spent $127.5 billion on buybacks, down from $161.39 billion quarter-over-quarter and from $131.56 billion year-over-year (Chart 2). The 1Q16 total was the second highest after the all-time high of $172 billion in 3Q07. We know what happened back then. By 2Q09, buybacks had shrunk to $24.2 billion. Too soon to declare a similar fate awaits these buybacks, but it is increasingly looking probable.
To a certain degree, we cannot fault corporations for not investing in capital projects. Post-financial crisis, growth has gone missing. Since 3Q09, real GDP has averaged 2.1 percent, versus 3.2 percent going back to 2Q47.
Corporate cash pile is on the increase. In 2Q16, S&P 500 companies held $1.37 trillion in cash and equivalent, up from $773 billion at 2Q09. (S&P Dow Jones Indices calculates cash ex financials, utilities and transportation issues since these companies maintain high cash reserves as part of normal operations.)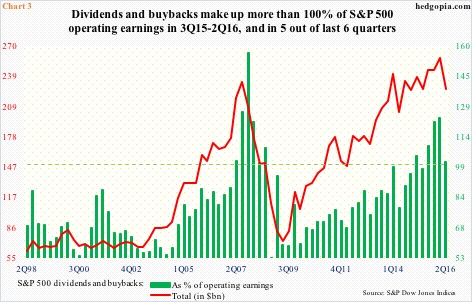
Enter buybacks and dividends, which corporations have aggressively used to “reward” their shareholders.
In 2Q16, dividends and buybacks combined, S&P 500 companies doled out $225.8 billion ($98.3 billion in dividends). On a four-quarter rolling basis, the two totaled $585.31 billion, down a tad from a record $589.41 billion in 1Q16. This has persistently risen over the years – to a point it is looking like these companies are simply chewing more than they can swallow, with 2Q16 being the fourth consecutive quarter – and five out of last six – of dividends and buybacks exceeding operating earnings (Chart 3). The latter was $222.8 billion in 2Q16.
More important, is it a better use of cash?
First off, one option corporations have is simply pay down debt – which amounts to money saved in interest payment. For the leveraged ones, a reduction in leverage would mean better covenants when they go out to borrow the next time.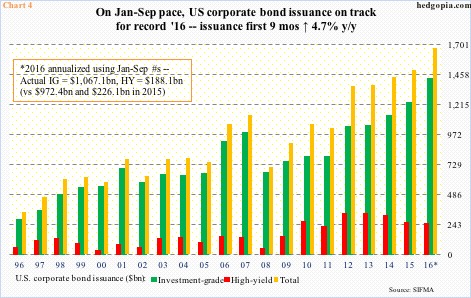
That said, thanks to the Fed’s zero interest-rate policy and quantitative easing, the cost of capital is suppressed. As a result, the required return to cover that cost is artificially less than what would normally be. This encourages leverage. U.S. corporate bond market debt was $8.4 trillion in 2Q16, up from $5.4 trillion at the end of 2008.
And if corporations maintain the pace of the first nine months this year, corporate bond issuance is on track for yet another record year (Chart 4). It is difficult to quantify, but a good chunk of this probably makes its way toward buybacks and dividends.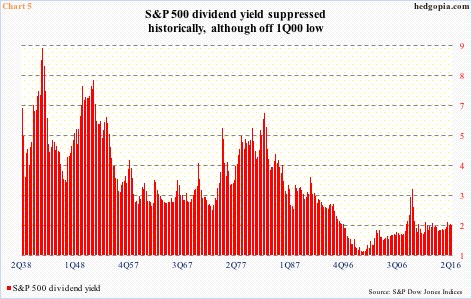
Dividend is cash in hand. Shareholders have the option to either reinvest in shares of the company or save or spend as they choose. The downside is, taxes have to be paid in the year it was received. It cannot be deferred. Besides, it incurs double taxation, as dividends are distributed after-tax. Up to a certain income threshold, individuals currently pay 15 percent tax on dividends.
It is worth pointing out that from January 1926 through September 2016, the annualized total return – consisting of both capital appreciation and dividends reinvested – for the S&P 500 was 10.1 percent. Of this, dividends make up 40.3 percent (courtesy of S&P Dow Jones Indices). In 2Q16, the dividend yield was 2.12 percent – poor historically but higher than 1.12 percent in 1Q00 (Chart 5).
Buybacks are a different animal. Companies use after-tax dollars to buy back shares. Any time a shareholder chooses to sell, s/he pays taxes if there are capital gains. Short-term capital gains are taxed at the investor’s ordinary income tax rate, while taxes on long-term gains vary from zero to 20 percent.
To benefit from a lower tax rate, the investor needs to hold at least a year. There is the rub. A year is a long time. Anything could happen.
A case in point: Between June 2005 and October 2007, the S&P 500 rallied 32 percent. Between 3Q05 and 3Q07, these companies bought back $1.06 trillion worth. Since that high, in about a year and a half, the index fell 58 percent through the March 2009 bottom. Between 4Q07 and 1Q09, only $512 billion worth was bought back.
Ideally it would make sense if these companies were buying back hand over fist in 2008 and 2009. But they were aggressively buying on the way up (Chart 2). That is the irony. They were spending more when prices were rising and less when prices were dropping – not a good use of cash.
Between dividends and buybacks, shareholders are better rewarded with the former – hands-down.
Thanks for reading!

