
- Semi rout after months of decline in orders for business capX proxy
- From INTC to TSM to SNDK, semi heavyweights pointing out biz slowdown
- SMH shorts stand no chance until longs are bothered by worsening earnings scene
It is not too often semis drop 4.5 percent in a single session! Wednesday’s drop was the steepest since the 6.6-percent drop on October 10 (arrow in Chart 1). That drop came toward the tail end of a sell-off that began in the middle of September. This one is different. By Tuesday, SMH was only three percent off early-March highs.
With that, the ETF has sliced through its mid-October trendline as well as its 50-day moving average. One can argue Wednesday’s action has completed a double top. Another crucial support is in play. After early weakness yesterday, bids showed up in defense of 52.50. It is a must-hold.
So far, so good. But why the sudden panic among investors?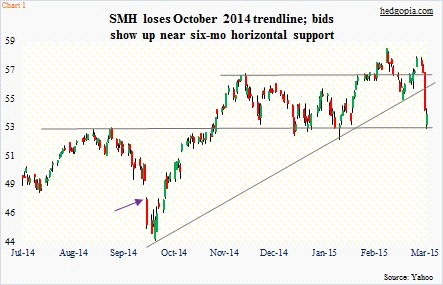
First off, orders for U.S. non-defense capital goods ex-aircraft – a proxy for business capital expenditures – has been declining since they peaked in August last year at $73.1 billion (Chart 2). February was $69.3 billion, with year-over-year growth decelerating to 2.1 percent.
Here is where it gets interesting. Beginning this month, y/y growth in these orders will have trouble growing, maybe even begin to go negative. Orders were $71 billion last March, and have stayed in the $70-billion range (except $69.2 billion May) until they peaked in August.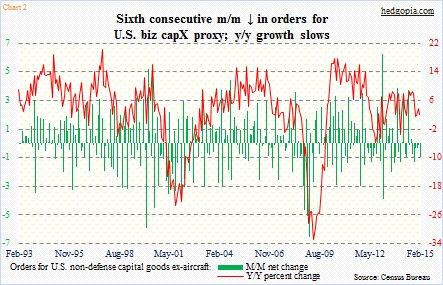
Orders for computers and electronic products are no different. They were $22.9 billion in August and $22.2 billion in February. Orders grew 5.8 percent y/y in February. But beginning March, this will begin to look different as last March orders shifted up to the $22 billion range, and has stayed in that range since. Inventories, on the other hand, have been growing faster. The result is a persistently rising inventories-to-orders ratio (the red line in Chart 3). Notice the persistently declining green line. Shipments were up 0.5 percent m/m in February and flat y/y.
Not trying to be an alarmist here, but in the past the red line when it is this high has brought bad news for the economy. The trend in inventories, shipments as well as orders has not been very encouraging for the last several months.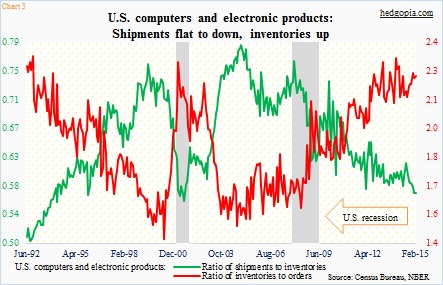
Now companies are sounding alarms.
Wednesday, TSM told a Credit Suisse conference that 1Q was tracking below forecast; things have slowed down in the past four to five weeks. It blamed dollar strength and weakness at customers’ business. Rumors have it that QCOM plans to give some business away from TSM to Samsung. NVDA, too, has said Samsung is a new foundry partner. But the dollar is a different story. Plus, the U.S. economy has not lived up to expectations.
Two weeks ago, INTC warned that its 1Q revenue would be $12.8 billion, versus its previous guidance of $13.7 billion. The latest chipmaker to warn is SNDK, which now expects $1.3 billion, versus its previous forecast of $1.4 billion to $1.45 billion – its second warning since mid-January.
Chipmakers are a great indication of global demand – along the lines of, or arguably even better than, copper.
For the most part, chips are sold in dollars. The greenback has been on a tear. From trough to peak since July last year, it has advanced 27 percent. The slope of the ascent is too steep. There are bound to be repercussions.
Just a few days prior to INTC’s warning, AAPL, in response to the strong greenback, raised prices on several products in many countries including Canada and Australia.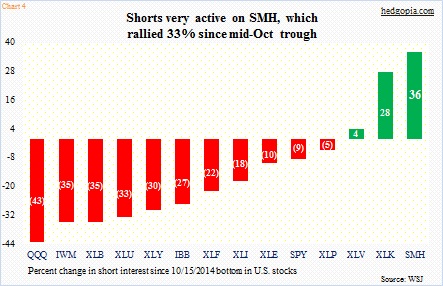
It has been a while since investors have valued equities through the eyes of bonds and not through the eyes of deteriorating earnings as well as macro data points. In the former, thanks to ZIRP, things do not look expensive. In the latter, they do. Multiples have gone up.
Since mid-October lows, SMH from trough to peak went up 33 percent, twice the rate of the S&P 500 large cap index.
Shorts have been active. Since end-December, short interest has surged 45 percent, to 22.2 million, and 36 percent since mid-October (Chart 4).
But shorts probably will not dictate the fate of the ETF.
It will be the longs who will decide what valuations to accord chipmakers. Will multiples be based on artificially suppressed discount rates or on deteriorating earnings picture? So far they have chosen the former.
We will soon find out if there has been a change in their sentiment. The ETF, as shown in Chart 1, is now trapped between 52.50 and 55.50-56. Should longs bail out/shorts get aggressive around that resistance, then we know winds are beginning to change.
