
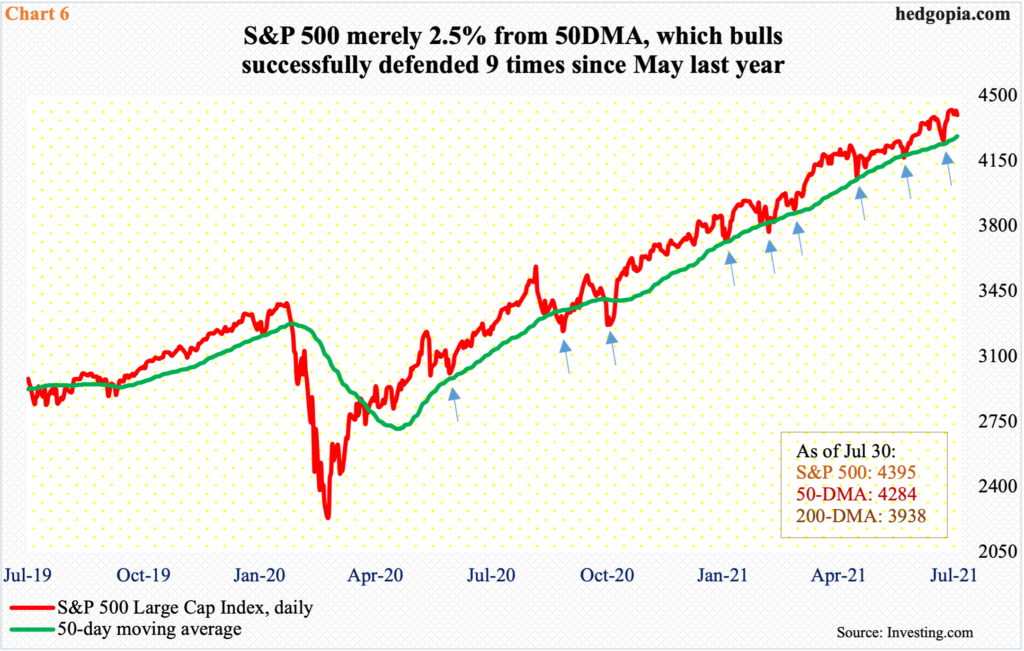
S&P 500 earnings are beating consensus estimates by a wide margin. Stocks, which had rallied massively into the season, are only trudging higher. Near term, they are likely to struggle to find positive catalysts. The 50-day, which is merely 2.5 percent away, is the one to watch.
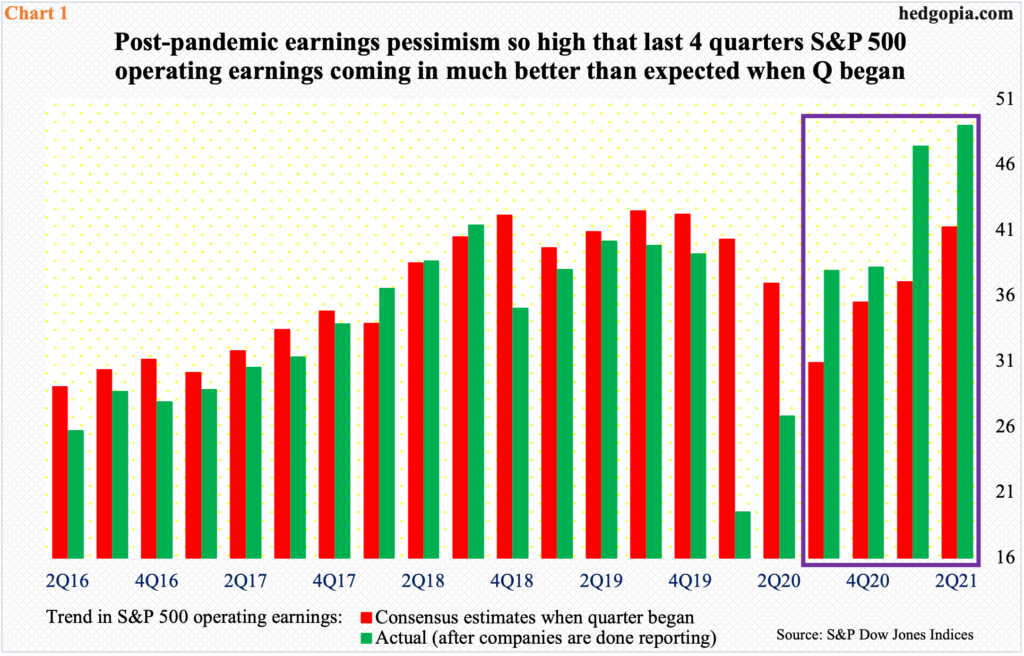
Earnings are coming in much better than expected. With just under 70 percent reporting as of last Thursday, S&P 500 companies have rung up $49 in blended operating earnings. At the end of the March quarter, meaning when the June quarter began, the sell-side were expecting $41.24. It turns out they were lowballing profoundly, which made way for upward revisions throughout the quarter.
Companies have continued to surprise as they began to report. At the end of the June quarter, they were expected to earn $44.15. As mentioned earlier, they have already taken home $49.
As a matter of fact, this phenomenon has been at work the last four quarters. In the past, the sell-side routinely lowered the bar as the quarter began. Chart 2 compares what companies were expected to earn when the quarter began and what they ended up earning when it was all said and done. Going back five years, for the most part, the green bars were shorter than the red ones. Then Covid-19 happened, abruptly driving the economy into a recession, and these analysts brought out their scissors.
In the end, this pessimism is what led to the upside surprise (box).
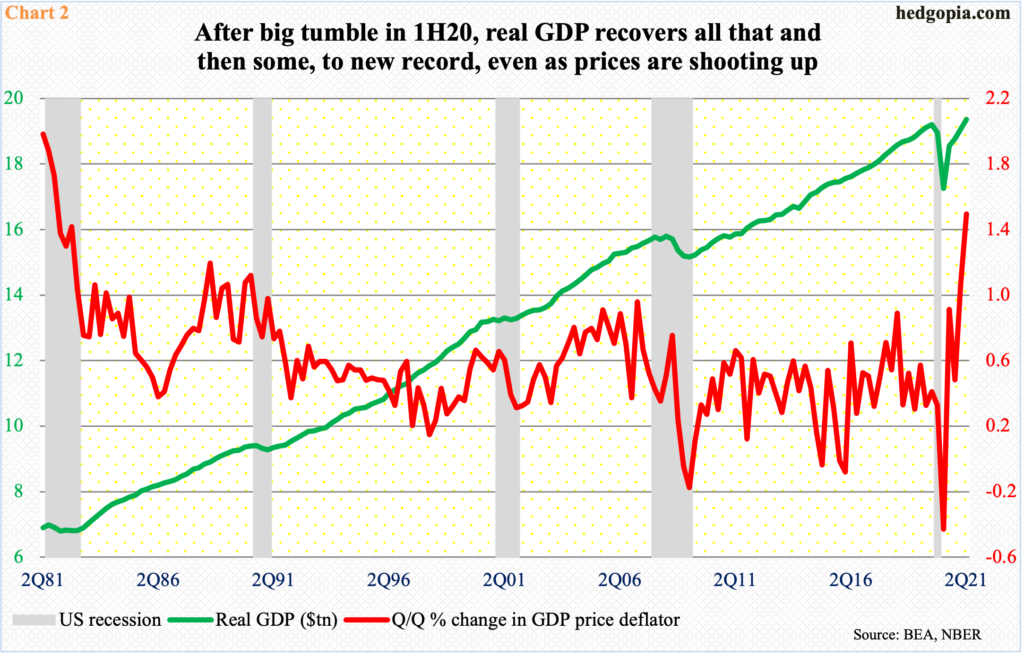
This phenomenon holds true pretty much across the US economy. Real GDP reached a high of $19.2 trillion in 4Q19 before the virus took hold. By 2Q20, the economy had shrunk by nearly $2 trillion to $17.3 trillion. But this was also the shortest recession ever, lasting just two months, beginning in February and ending in April. The recovery since has been no less impressive. The first print (out last Thursday) showed real GDP grew 6.5 percent last quarter to $19.4 trillion – a new high (Chart 2).
Before this, the economy grew by 6.3 percent in 1Q21, 4.5 percent in 4Q20 and 33.8 percent in 3Q20. This preceded contractions of 31.2 percent in 2Q20 and 5.1 percent in 1Q20.
All this heightened activity has put upward pressure on resource use, and on prices. Inflation is perking up. In the 12 months to June, headline and core CPI rose 5.3 percent and 4.5 percent, which is the fastest pace since July 2008 and November 1991 respectively (chart here). Headline and core PCE, which is the Fed’s favorite measure of consumer inflation, increased four percent and 3.5 percent year-over-year in June – the most since July 2008 and May 1991 respectively.
The upward pressure on prices is also reflected in the GDP price deflator, which in 2Q21 jumped 1.5 percent sequentially; the last time this metric was higher was in 4Q81 (Chart 2).
The Fed, which operates under a dual mandate of maximum employment and price stability, views the recent increase in inflation as transitory. Its policy is rather driven by jobs, which is yet to reach a pre-pandemic high.
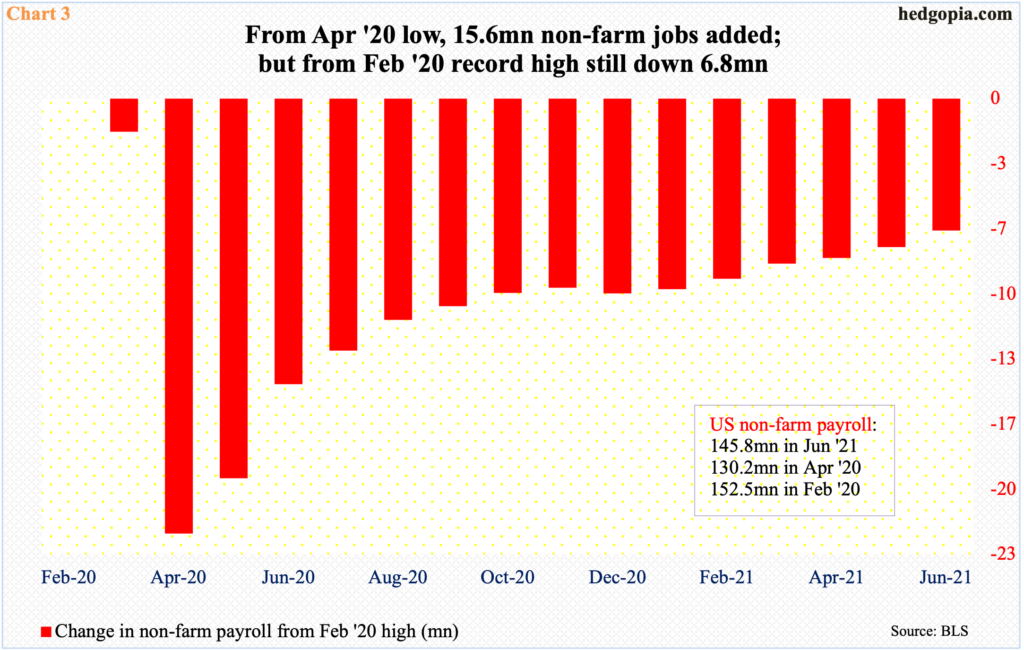
In June, non-farm jobs rose 850,000 month-over-month to 145.8 million. Since April last year, 15.6 million jobs have been created, but another 6.8 million is needed to match the pre-pandemic high of 152.5 million from February last year (Chart 3).
The Fed’s sole focus on jobs has meant continued ultra-loose monetary policy. Every month, it buys up to $80 billion in treasury notes and bonds and $40 billion in mortgage-backed securities. As of last Wednesday, the central bank held $8.2 trillion in assets, up from $4.2 trillion in early March last year. The fed funds rate has since been left at a range of zero to 25 basis points.
All this stimulation translates to oodles of liquidity sloshing around in the system, looking for a place to be deployed. This is also beginning to raise questions as to if this is needed at all at this stage of the economic cycle.
Of late, the number of hawkish voices within the FOMC has been getting louder, although they continue to be in the minority. The likes of St. Louis Fed President James Bullard have begun to argue that the Fed should begin to taper its bond purchases.
Last week’s FOMC statement slightly tweaked the language pertaining to the progress that has been made towards the economic goals the Fed hopes to achieve before slowing down its bond buying, raising the possibility of tapering toward the end of the year.
There is not a whole lot of history to go back and look as to how this might impact assets. During the 2013 taper tantrum when then-Chair Ben Bernanke suggested the Fed might reduce bond purchases yields shot up but equities barely blinked. By the way, the Fed never got around to actually tapering back then, continuing its quantitative (QE) program.
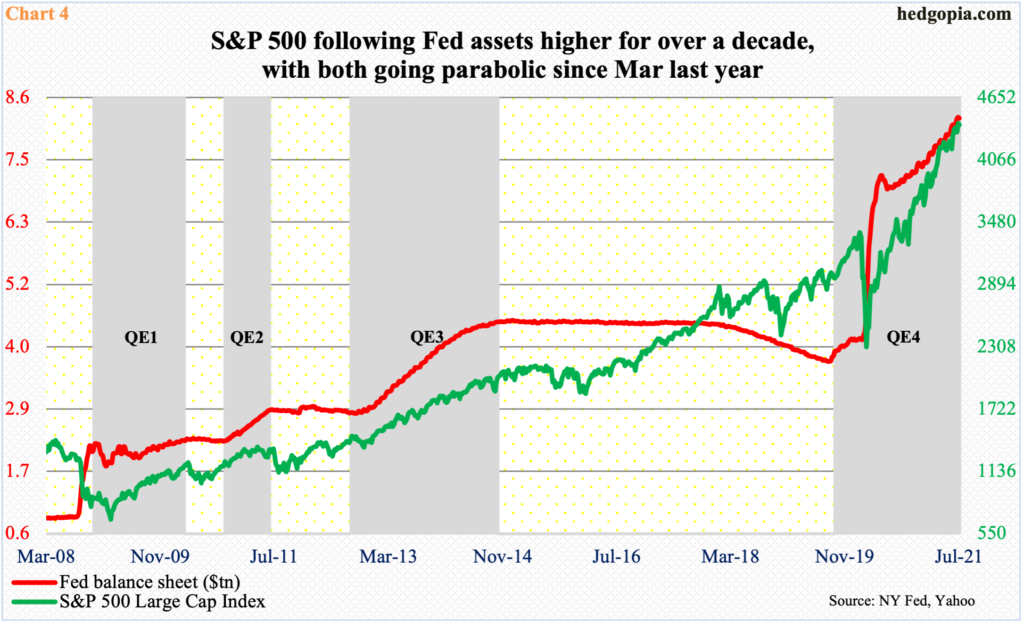
At the time, Fed assets peaked in January 2015 at $4.5 trillion, then went sideways for another three years before downshifting and then bottoming in September 2019 (Chart 4). Interestingly, the balance sheet began to trend higher before Covid-19 began to wreak havoc – and going parabolic once the virus took hold.
So, the obvious question is how the reduction in the bloated balance sheet might reverberate through assets, not the least of which are equities.
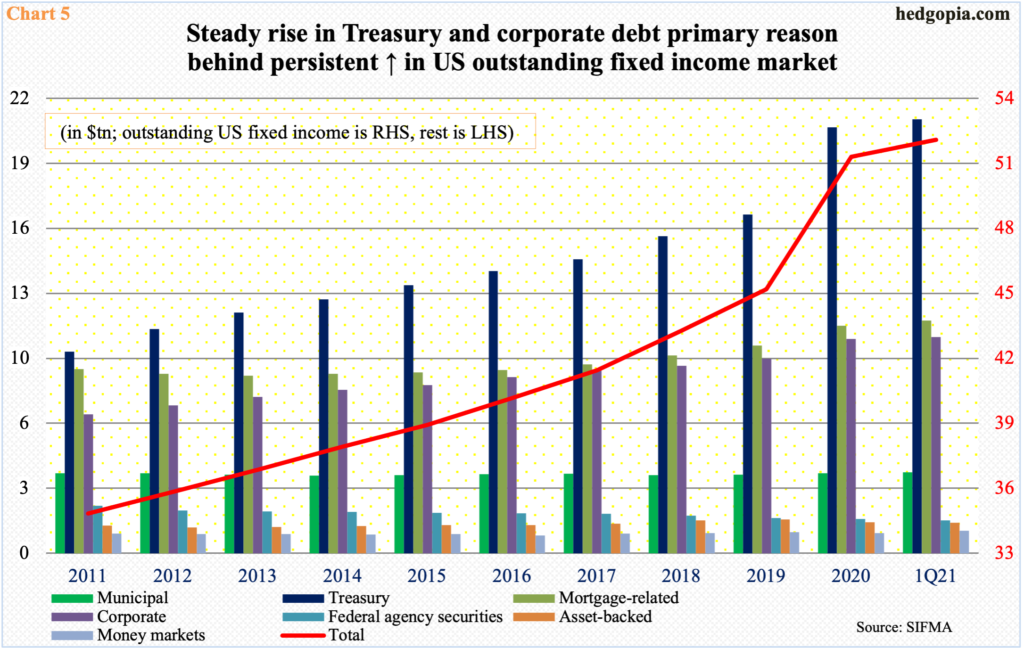
There are two possibilities: (1) History repeats itself. Since the 2008 financial crisis, the balance sheet has only trended higher (Chart 4). Just before that crisis, Fed assets made up 10 percent of nominal GDP; now, it is 36 percent. Across the system, debt has gone through the roof (Chart 5). The Fed cannot afford higher interest rates and will not taper or tighten on a sustained basis. At some point, the balance sheet will once again be used as a tool. In this scenario, barring minor corrections here and there, stocks will maintain the current upward trajectory. (2) This will continue until inflation at some point goes hyper. The dollar gets debased, and the real value of debt gets depreciated, which is what a debtor wants. If, and when, this unfolds, stocks in all probability will crack. It is also possible that equities being a discounting mechanism will begin to discount this if they genuinely believe in this scenario. Central bankers will try to stem the damage by once again using QE but it would not work.
Alternatively, the men and women in Eccles Building responsible for the nation’s monetary policy open their eyes and reverse their current policy before it becomes irreversible, letting equities and other assets go where they belong. In this scenario, stocks will probably take a good hit but this should help set up a solid foundation for future, organic gains.
Regardless how things evolve medium- to long-term, it is always a good idea to keep abreast of levels where bids overwhelm asks, or the other way around.
Right here and now, the 50-day moving average is the one to watch on the S&P 500 (4395). The large cap index last Thursday posted a new high of 4430, but bulls were unable to hang on to it, losing 0.4 percent in a spinning top week. The candle showed up after the prior week’s bullish engulfing candle.
With the earnings season winding down, bulls are likely to struggle to find catalysts to push the index higher. The daily is now extended, with weekly and monthly in overbought territory for a while now. Immediately ahead, there is support at 4370s.
Importantly, going back to May last year, bulls have successfully used the average as support nine times, including one two weeks ago (arrows in Chart 6). We can tell sentiment has shifted – duration and magnitude notwithstanding – if this gets decisively breached. The average is only 2.5 percent away.
Thanks for reading!
