
Margin debt rose in April. US stocks had a very good April. Yet, investors do not seem to be in a mood to aggressively add to leverage – the same way they are leaning more toward large-caps than small-caps.
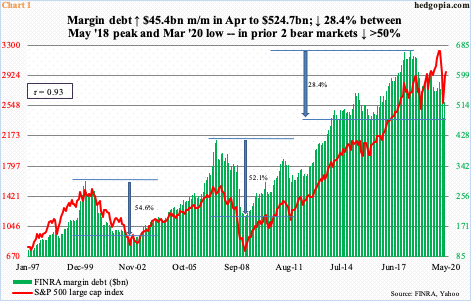
FINRA margin debt rose $45.4 billion month-over-month in April to $524.7 billion. The S&P 500 large cap index jumped 12.7 percent last month. The March total of $479.3 billion was at a four-year low, down 28.4 percent from the May 2018 record high of $668.9 billion. If it turns out the March low was THE low, then margin debt would have diverged from history. In the prior two bear markets, it collapsed north of 50 percent from peak to trough (Chart 1).
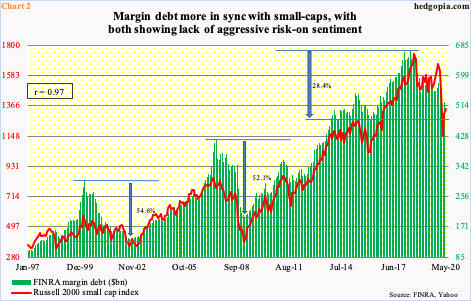
Speaking of divergence, margin debt has diverged with large-caps for a while now and is more in sync with small-caps.
In 2018, as previously mentioned, margin debt peaked in May, followed by a peak in the S&P 500 in September. The latter corrected for three months and bottomed in December, before rallying to new – and newer – highs. It would not peak until February this year. Margin debt kept falling, until the low this March.
The Russell 2000 small cap index, on the other hand, peaked in August 2018 and made a lower high in January this year, just before the rug was pulled out from under US stocks in February. So, for a signal as to which way margin debt is headed, it is probably worth focusing on the Russell 2000, not the S&P 500. Indeed, investors do tend to gravitate toward small-caps more than large-caps when they are in a mood to take on risk. This obviously holds true with margin debt. We are talking leverage here, which costs money in the form of interest.
This fact is borne out by the correlation coefficient between margin debt and the Russell 2000. Between January 1997 and April this year, the linear relationship was nearly perfect – 0.97 (Chart 2) versus 0.93 with the S&P 500.
Hence the need to watch the Russell 2000. It continues to lag versus its large-cap peers such as the S&P 500 and the Nasdaq 100 index, with the latter in particular on fire. Off the March lows, the Russell 2000 has retraced just over 50 percent of its February-March collapse, while the other two indices have retraced 61.8 percent (also known as the golden ratio in Fibonacci lingo).
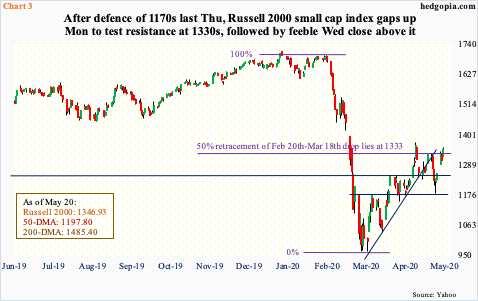
Wednesday, the Russell 2000 (1346.93) poked its head out of 1333, which represents the 50 percent retracement. In fact, toward the end of April, it rallied to 1373.39, but staying above this resistance has proven difficult (Chart 3). Just under 1400 lies gap-down resistance from March 9th.
From small-cap bulls’ perspective, the good thing is that by defending 1170s last Thursday they successfully pushed back bears that seem to be gaining momentum early last week. But this can also mean less availability of buying power as time passes. Inability to decisively take out 1330s sooner translates to a need to defend 1250s and 1170s again and again. At some point, buying power runs out. That is the risk facing the bulls.
Thanks for reading!
