
- Signs late last week WTI itching to move higher play out perfectly
- Oil as much a physical commodity as it is for investment/speculative purposes
- After 20-plus-percent move in four sessions, healthy if it retreats and finds support at 47
Some nice price action on crude oil. At long last! As suggested on Saturday’s post, there were nods and winks from the West Texas Intermediate crude last week that it was itching to go higher. Off the lows of $43.58 on January 29th, it is now up nearly 22 percent (Chart 1). In four sessions! Nothing normal about that, but not abnormal to have this kind of a countertrend rally either given the shellacking oil has suffered the past seven months. Since the June high until the low last week, it was down nearly 60 percent.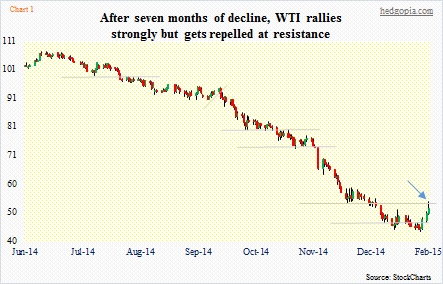
Oil is no longer just a physical commodity, the way, let us say, iron ore is. Increasingly, it has become an asset class widely used for investment/speculative purposes. This can be an important factor for any change in direction in the short term. Long-term, of course, fundamentals win out; supply-demand dynamics will/should prevail. But in the short-term, a mismatch between supply and demand can come from another quarter – investor demand for the commodity as an asset class. From this perspective, sentiment had gotten way too bearish on oil.
The question then becomes if there has been sufficient change in fundamentals to support a lasting bottom in the price of crude.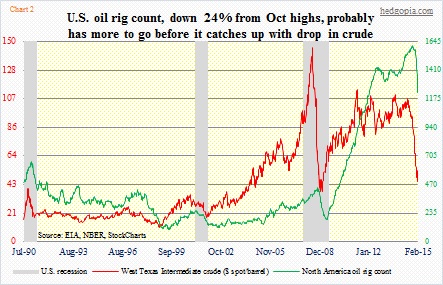
As oil spiked this past Friday, one of the reasons cited for the rally was the drop in the North American rig count (Chart 2). The total number of rigs fell by 90 last week, to 1,543. From the September high of 1,931, they are now down 20 percent. This includes both oil and gas. Chart 2 just focuses on oil, which saw a drop of 94, to 1,223 last week. From the October high of 1,609, oil rigs are now down 24 percent. In the prior downturn, between November 2008 and June 2009, they fell 60 percent. Back then, the buildup prior to the downturn was nowhere near as parabolic as has been the case this time around. Between June 2009 and October 2014, the oil rig count surged nine-fold, from 179 to 1,609.
So unless oil price begins to sustainably rally, these rig counts probably have ways to go on the downside. Even the drop we have seen so far, Morgan Stanley puts it this way: “Thus far, lower-performing vertical and directional rigs have been cut more than horizontal.” The longer the price stays lower, the higher the pain for operators – a base case for now.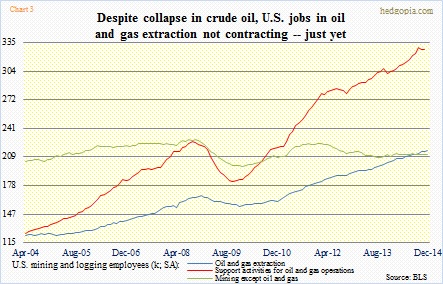
OPEC, by default Saudi Arabia, is sitting tight and seems determined to let the status quo continue. In the meantime, we are beginning to hear cuts in capital expenditures, and some layoffs. We will learn more this Friday as to if the drop in price is beginning to adversely impact oil-extraction-and-production jobs in the U.S. Up until December, momentum has been intact (Chart 3).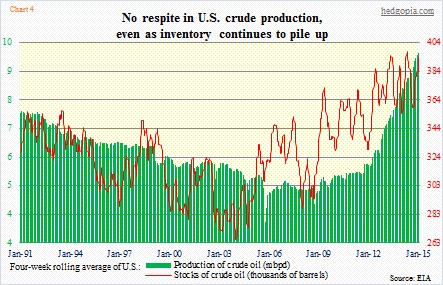
Yes, rig counts are down. However, if price has genuinely found a bottom and begins to gradually rise, that is one less incentive to cut production. Which is not what the market needs, and not what the big honcho, Saudi Arabia, wants. At 9.2mn barrels a day, U.S. production is at a record high. Production has doubled in the last six years (Chart 4). Inventory is in tow. Excluding SPR (strategic petroleum reserve), it currently stands at 407k barrels – also a record. (The chart uses four-week moving average for smoothing purposes.)
By every indication, it is going to be a long slog. That is the long-term picture. Right here and now, there are different variables doing the push and pull. In the futures market, large speculators held on to most of their net longs in WTI futures. Chart 5 combines both NYME and ICE. Now with oil acting better, they could very well be adding. We will find out later this week.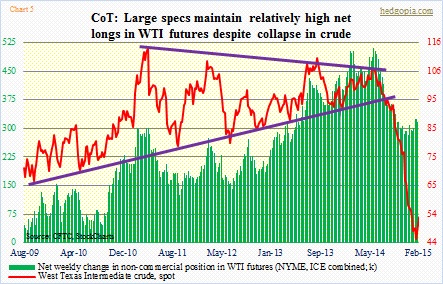
Crude also has the dollar in its favor right now. As was the case with crude which was itching to go higher, the dollar is itching to go lower. But in the end, oil has to ignite buying interest in its own merit. In yesterday’s session, it rallied all the way to 54.24, before retreating. Guess where they started selling? Right at resistance (blue arrow in Chart 1). That is the problem crude faces. It has had such a bad breakdown on its way down there is no shortage of resistance overhead. Rather than continuing to rally, the case for sustained bottom rises if it retreats right here, finds support at $47 and has another go at that resistance. A failure at 47 will begin the next leg lower.

dick1931
My hypothesis is that reported world crude inventories must begin to shrink due to rising consumption or falling production or a combination of the two for oil prices to rise based on fundamentals. This appears to be be months if not years away barring major new production interruptions. Yesterday Euan Mearns published a world roundup of crude production in seeking alpha. Production is still on a rising trend.