Breakouts are galore in U.S. equities. Of the three major indices, the S&P 500 and the Dow Industrials have managed to push into record territory. The Nasdaq is a laggard – yet to get past early-March highs. Ditto with the small-caps as well as the bio-techs. IBB in particular is trying to stage a decent rally after having suffered a month-and-a-half-long, 25-percent decline beginning late February, but lacks pre-correction momentum. Also, tech in general as well as the small-caps are acting better but lack the vigor they possessed prior to the March-April swoon. From this perspective, not all the gears are in sync. Having said that, charts for IWM and the Nasdaq have turned positive.
Action in the tech land is not uniform; market participants are gravitating toward large-caps. Of late, overall this has clearly been an overriding theme, evident in how the S&P 500 has been acting. The Nasdaq 100 is leading its larger brethren, the Nasdaq, as the former has surpassed its early-March highs. While renewed momentum in AAPL is greatly contributing to this, increasing preference for large-caps cannot be denied. It is a matter of debate as to if, given the age of this bull market, this is a canary in the coal mine. But for now, price action trumps everything.
If one has to nitpick, then here are a couple of things.
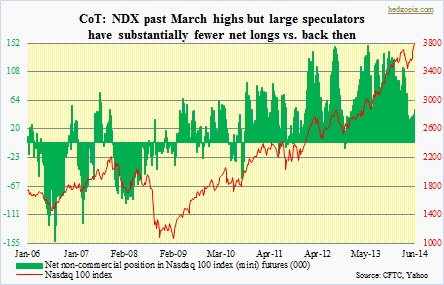 AAPL looks tired, or will soon get to that stage, and given its weight in the NDX, this will be an important factor to consider. Large speculators have been quietly adding to net longs in NDX futures, with a subtle difference. Early March, they were net long over 100k contracts. Now, even as the index is sitting at multi-year highs, these futures traders are not as aggressive – they were only net long 50k in the latest week. Regarding e-mini S&P 500 futures (not shown here), non-commercials are still net short. These traders have not quite gotten the recent move in the SPX right. The index bottomed early February and has added 200 points since, even as large speculators began to go net short these futures (e-mini S&P 500) – they are currently net short 80k contracts.
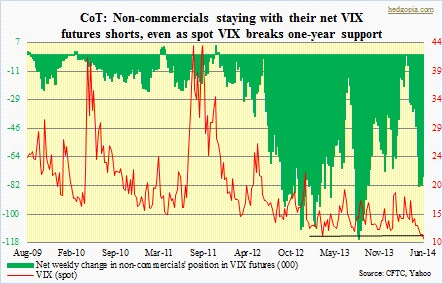 And to make things even more confusing, these traders are maintaining their net short position in VIX futures. They have done an excellent job of identifying the near-term trend in the VIX, which last week broke one-year support and is less than a point and a half away from the December 2006 all-time low of 9.39.
Can the so-called fear index be pushed even lower from here?
One thing is for sure. The recent strength in SPX is driven by more than one or two sectors. Transports are at new highs. So are industrials, materials, energy, and consumer staples, even as utilities, healthcare, and consumer discretionary are literally sitting at/underneath all-time highs.
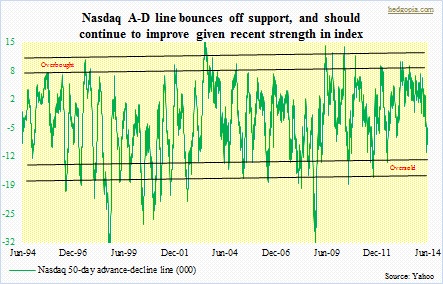
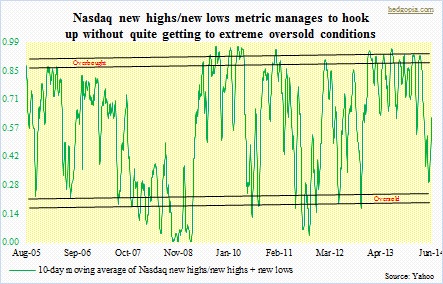 Laggards are financials and tech. The latter in particular is seeing some divergence in that the likes of AAPL are doing the heavy-lifting. Hence the outperformance of the NDX vs. the Nasdaq. So it is a little too soon to say if what we are witnessing in the Nasdaq is only an oversold bounce or something concrete in the making. As the accompanying chart (as well as the one below) shows, the index has managed to bounce right near oversold conditions – regarding both highs/lows and advance/decline. If the past is any guide, both these metrics have further to rise before they reach overbought conditions. For that to happen, unless we experience massive divergence between the Nasdaq and the S&P 500, the latter, which is already grossly overbought, needs to continue to stay extended. If this scenario does not quite pan out that way, then bulls probably still have a week or two on their side before near-term technical conditions (moving averages, etc.) start to roll over.