
- Big tailwind for stocks has come from grossly oversold technical conditions
- Several indicators are lagging – failing to confirm recovery highs in major U.S. indices
- Some signs stocks want to rest; could be important as SPX sits right underneath major resistance
 Since we last discussed the indicators on this post, stocks have come a long way. Only a couple of sessions after the October 15th reversal, things were still tentative back then. The S&P 500 Large Cap Index was still trying to shake off the jarring19-session, nearly-10-percent drop. The index had been pushed under both its 50- and 200-day moving averages, as were all the other major U.S. indices. Then things changed. Not bit by bit, but in a hurry. First they retook the 200 and then the 50. Shorter-term moving averages began to hook up. Post October 15th bottom, it only took 15 sessions for the S&P 500 to recoup the losses, before proceeding to make a new high.
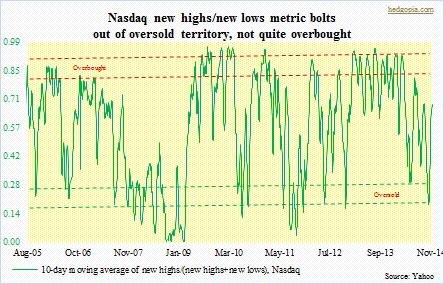
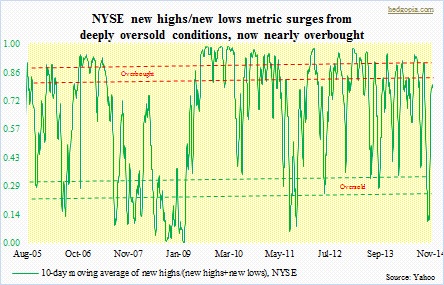
As it turns out, short squeeze probably did not play much of a role in the rally. Between October 15th and October 31st, short interest dropped a mere 0.1 percent on the Nasdaq (9bn – near six-year high) and 2.2 percent on the NYSE (15.4bn – near three-year high). The indices surged 10 percent during the period. What probably did play quite a bit of a role was the existence of oversold conditions on several technical indicators, some of which are discussed here.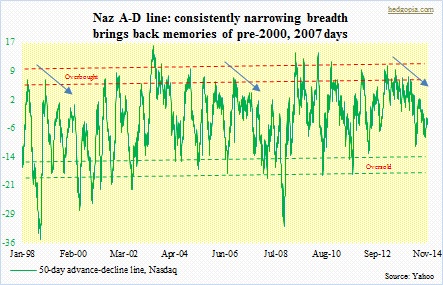
Back then, of the six discussed, except for the Nasdaq A-D line, they were all oversold, some deeply. These conditions needed to be unwound. They are still in the process of doing so. As we can see, none of them have quite gotten to overbought levels yet. Some are two-thirds of the way, some more.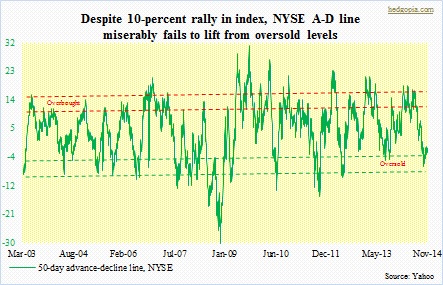
And then we have this. The advance-decline line on both indices is absolutely horrible. Since October 17th, they have only gone up a tad – essentially unchanged. And we have a situation in which the indices have gone up 10 percent. The NYSE is still below its September 4th all-time high. The Nasdaq has made a new recovery high, but the A-D line cannot get it going. And in the latter’s case, it is nothing new. As shown above, the Naz A-D line has been making lower highs for well over a year now. Rather ominously, this is exactly the setup we had leading up to 2000 and 2007 peaks.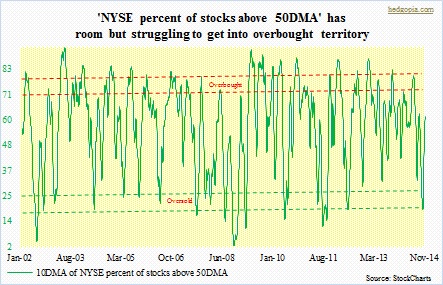
As the saying goes, price trumps everything, and on this no one can complain. Stocks have rallied vehemently. The V in the V-bottom could not have gotten any narrower. But how things progressed to get to where we are today can influence what transpires tomorrow. From this perspective, one would hope these indicators were a little stronger. Even as the S&P 500, the Dow and the Nasdaq have surpassed previous highs, these indicators are lagging. Now the question is, as can be seen in these charts, there is room for more unwinding, but will it happen or will these indicators simply roll over?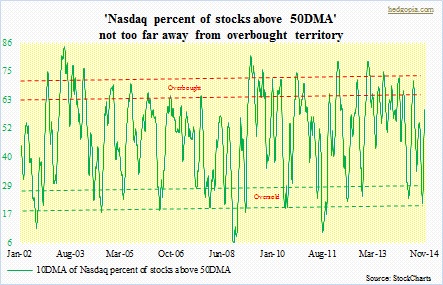
On the plus column, seasonality is in bulls’ favor. Nonetheless, everyone and their dog know this. Since that October 15th bottom, defensive sectors have outrun the offensives. Action yesterday in the small-caps in particular was foreboding. Semis are seeing distribution. And the S&P 500 (2039.32) has seen back-to-back dojis. These are signs that things need to rest. We don’t know what duration – short-, medium- or long-term.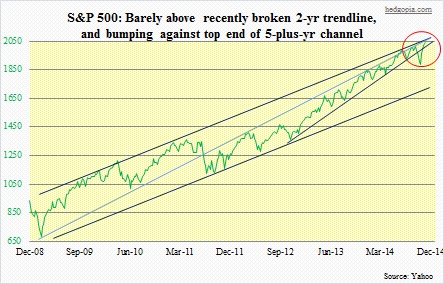
Markets will tell us. Next week will be crucial. Will give us clues as to if it is time to go short. Importantly, the S&P 500 is bumping right against the top end of a five-plus-year channel, which has been there since the bull market began.
