
There is an air of invincibility among equity bulls. A contrarian-minded investor may find this uncomfortably lop-sided, but nothing says it cannot continue in a seasonally favorable period. The recent jump in investor sentiment is yet to translate into consumer sentiment, which in due course will have bearing on spending. This eventually can reverberate through corporate earnings.
Major US equity indices continue their upward momentum. Small-caps continue to go parabolic, while large-caps are still trudging higher. The former group is outperforming in the wake of the November 3rd presidential election and particularly after positive vaccine news from Pfizer (November 9) and Moderna (November 16).
Small-caps are more domestically focused than their larger-cap peers which also have international exposure, hence benefit more the sooner the US economy gets back to normal. Investors are betting this happens next year and are gravitating toward small-caps. This has acted as a self-fulfilling prophecy in that it then attracts more investors who treat the small-cap action as a signal.
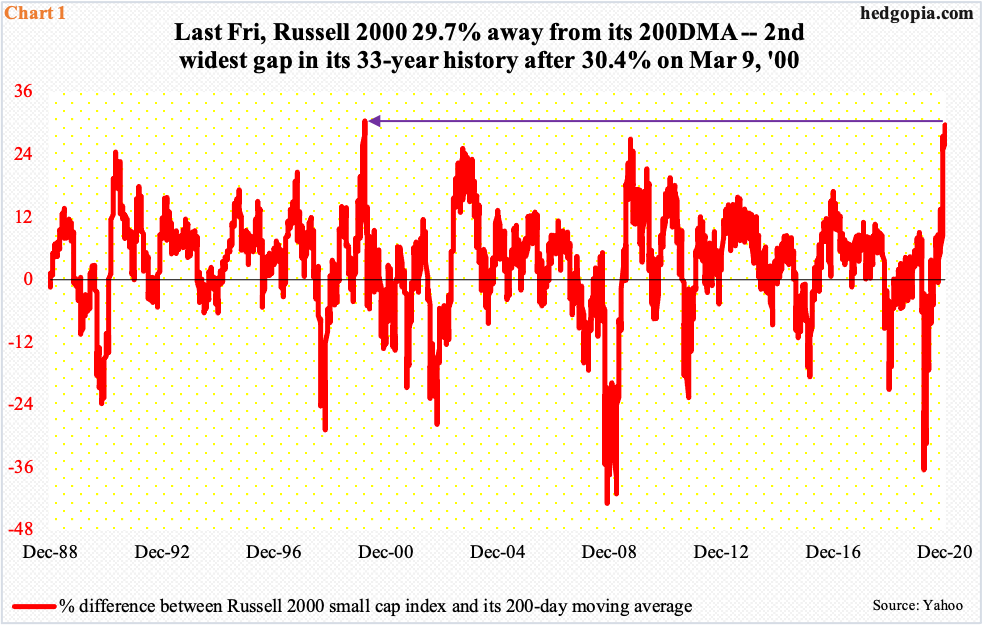
Consequently, the Russell 2000 last Friday was 29.7 percent away from its 200-day moving average. This is the widest gap in the small cap index’s 33-year history since March 9, 2000 when a record 30.4-percent gap had opened up (Chart 1). The Russell 2000 peaked a day later back then and went on to lose 28 percent in the next five weeks, and 47 percent by the time it bottomed in October 2002.
It is obviously too soon to say if a similar fate awaits these bulls. This much we know. Other metrics show a similar buildup in optimism.
In the options market, investor fascination with calls has gone through the roof. It is important to point out that these call buyers have so far been on the right side of trade as equity indices continue to hit new highs. Once again, this acts as a self-fulling prophecy.
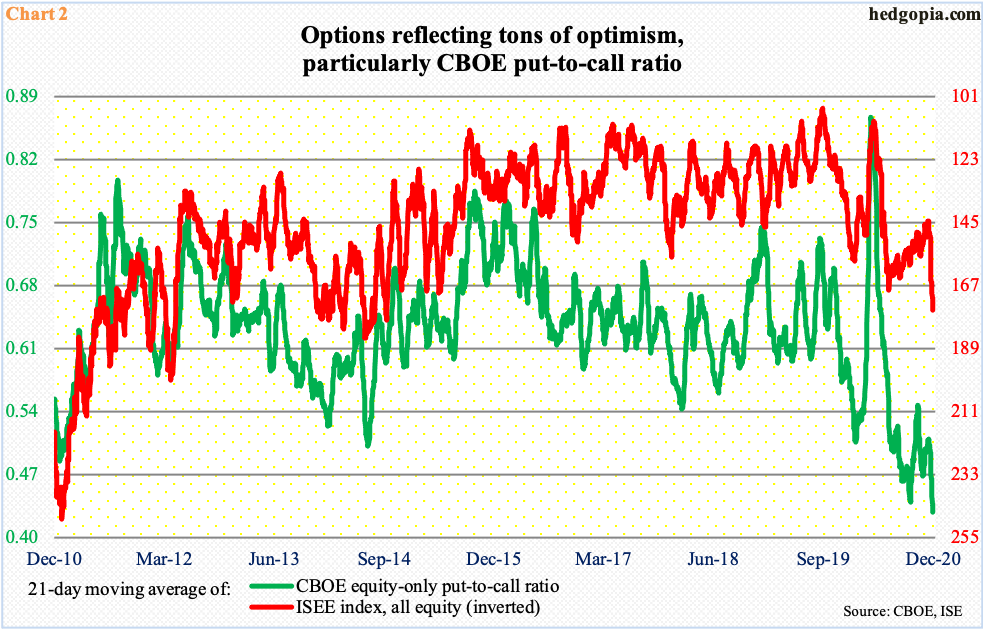
Last week alone, the CBOE equity-only put-to-call ratio produced readings in the 0.30s in three sessions, and in the 0.40s in two. The 21-day average dropped to 0.428 on Friday – a new low (Chart 2).
Interestingly, the ISEE index has room to continue rising. It is a call-to-put ratio, hence inverted in the chart. It excludes trades from market makers and brokers/dealers, and only uses opening long trades. Market makers need to hedge exposure all the time. Retail, on the other hand, bets on direction. Many consider ISEE cleaner than the CBOE put-to-call ratio.
In any event, the 21-day average of the ISEE index has sharply risen since mid-November; the momentum can continue should investors continue to gobble up calls in a seasonally favorable period.
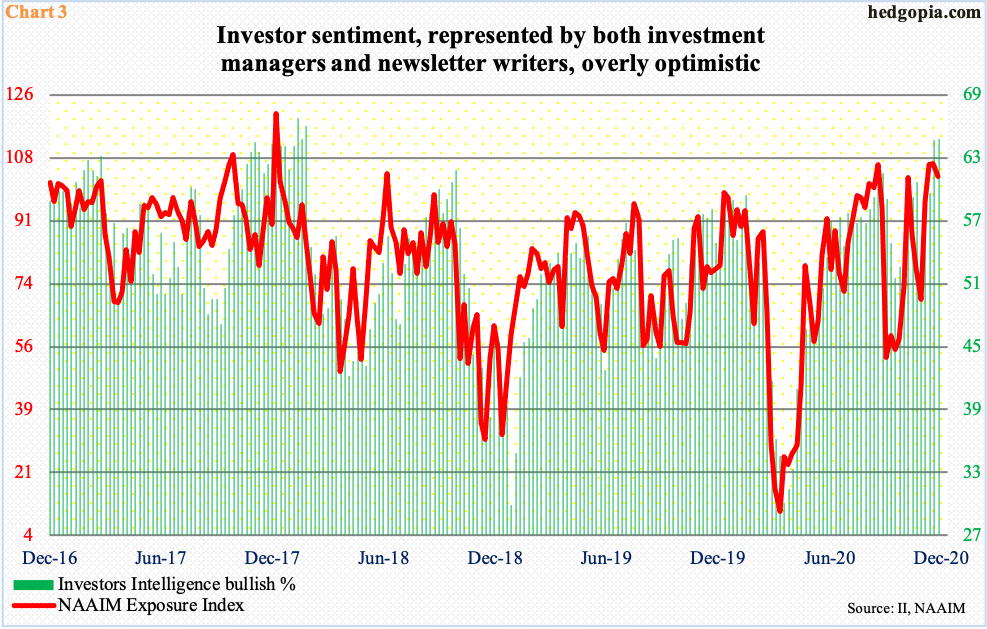
A similar message is coming out of Chart 3. It plots investor sentiment representing newsletter writers (Investors Intelligence) and investment managers (NAAIM Exposure Index).
Last week, Investors Intelligence bulls inched up three-tenths of a percentage point week-over-week to 64.7 percent, which was the highest since January 2018. Historically, it is hard to sustain in the 60 percent range, but back then bulls registered 60 percent or higher for 17 consecutive weeks. This time around, last week’s reading is the second in a row, and third in last six.
Similarly, the NAIIM reading dropped 3.6 points w/w last week to 103.2, but this was a third consecutive 100-plus reading. Going back to July 2006, there have been 23 100-plus readings, seven of which occurred in the past four months. Even though it increasingly feels like these professional money managers are all in, the record high of 120.7 was set in December 2017.
In other words, as elevated as sentiment is, in the right circumstances for bulls, it can always continue to creep deeper into extended territory.
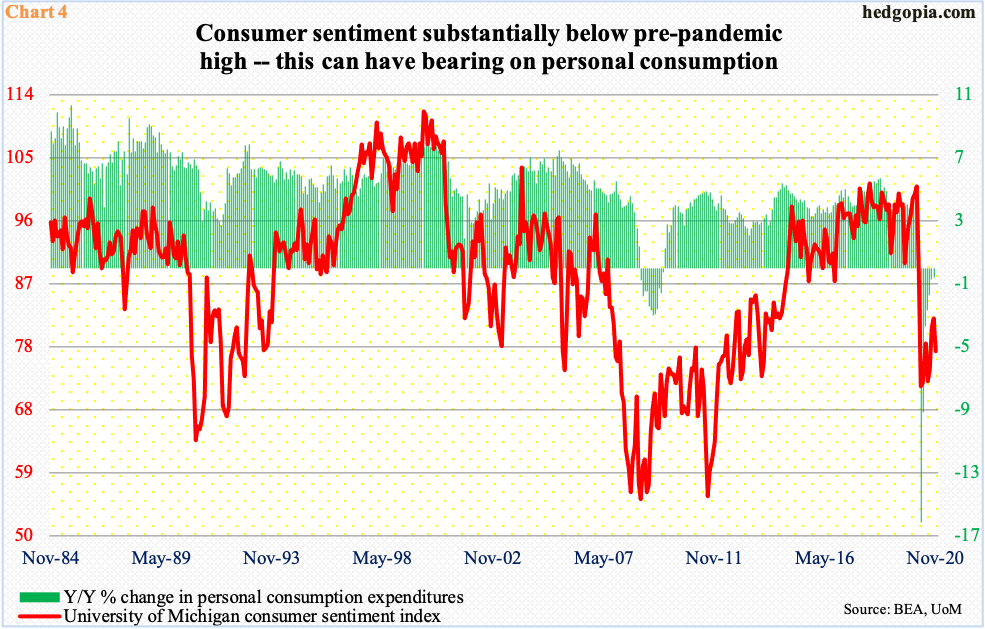
Longer-term, the prevailing effusive investor sentiment is yet to percolate through to consumer sentiment.
In November, stocks surged, with the Russell 2000 up a massive 18.3 percent, the Nasdaq 100 11 percent and the S&P 500 10.8 percent. In contrast, the University of Michigan’s consumer sentiment index dropped 4.9 points month-over-month to 76.9. (December’s preliminary reading will be out this Friday.)
Earlier, from February’s 101, consumer sentiment dropped to 71.8 in April, with the eventual recovery anything but convincing. A less confident consumer is not good news for spending. In April, personal consumption expenditures tumbled 16.1 percent year-over-year to a seasonally adjusted annual rate of $12.1 trillion, before gradually improving to October’s $14.6 trillion, which is still down from January’s pre-lockdown $14.9 trillion.
If the trend does not improve soon, it will have repercussions for Chart 5.
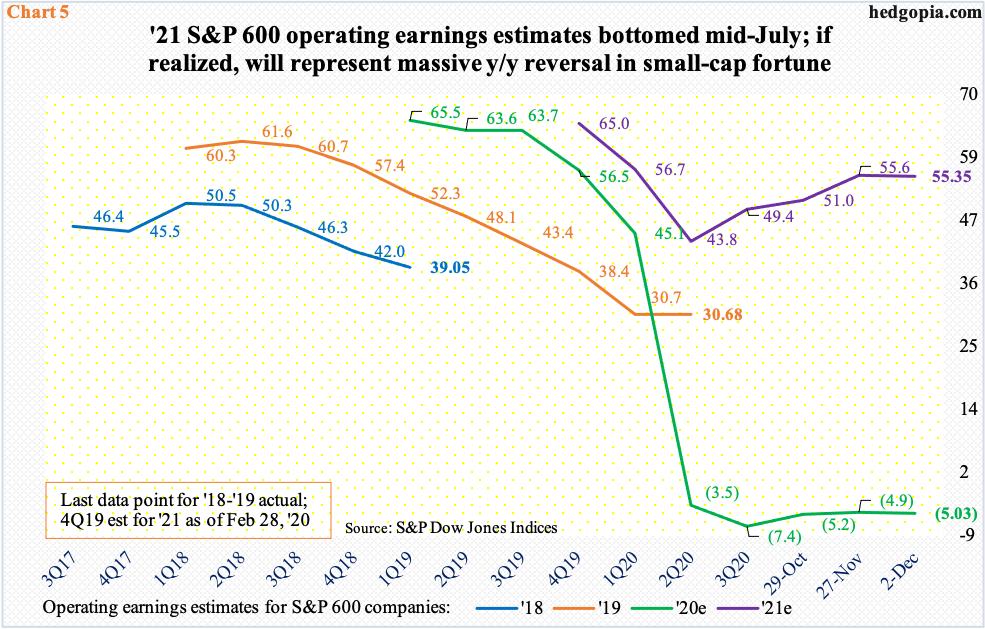
Corporate profits tumbled this year. As of last Wednesday, S&P 500 (large cap), 400 (mid cap) and 600 (small cap) companies were expected to earn (lose) $120.86, $71.18 and ($5.03) this year. Last year, they earned $157.12, $94.98 and $30.68, in that order.
With one quarter of earnings to go this year, investor focus has naturally shifted to next year. Plenty of optimism is in the air. The sell-side expects S&P 500 companies to ring up $166.19, S&P 400 $113.58 and S&P 600 $55.35 next year. In all three, the revision trend has decidedly shifted upward over the past several months. In small-caps’ case, the inflection happened mid-July (Chart 5).
The sell-side in this instance agrees with small-cap investors that things will get a lot better next year. Arguably, a lot of this optimism is already in the price, although it is hard to quantify how much. Hence the possibility that sentiment can continue to get more lop-sided or reverse right here and now. Unwinding is a matter of when, not if. If past is prelude, the higher the top, the bigger the drop.
Thanks for reading!
