
Buybacks by S&P 500 companies continue at an aggressive pace. This makes up for shortfalls coming from margin debt and money market assets. Help of late is also coming from the Fed.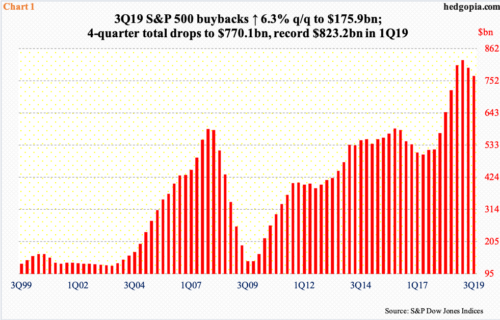
Buybacks snapped back up in 3Q19. After a two-quarter decline totaling $57.5 billion, S&P 500 companies spent $10.4 billion more in buying back their own shares than they did in 2Q19. The all-time high of $223 billion was set in 4Q18.
Using a four-quarter total, buybacks reached $770.1 billion in 3Q19. They have declined in each of the two quarters since peaking at record $823.2 billion in 1Q19 (Chart 1). Despite the recent decline, these are massive numbers – and obviously a tailwind to US stocks.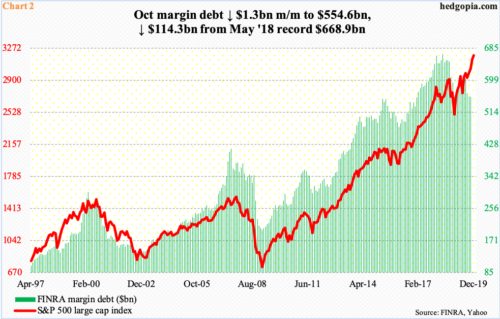
This is coming at a time when margin debt is not quite cooperating. November’s data should be out any day now, but October showed FINRA margin debt fell $1.3 billion month-over-month to $554.6 billion (Chart 2).
Margin debt peaked as early as May last year at $668.9 billion, so this metric has diverged with how stocks have performed. The S&P 500 large cap index (3191.14) is less than 10 points from its record high, having rallied 18 percent from May last year when margin debt peaked. Since that high, margin debt is down $114.3 billion.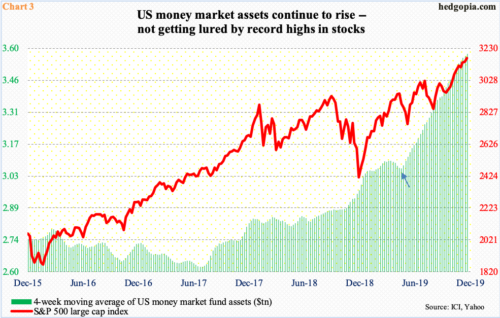
This is also at a time when cash continues to pile up on the sidelines. US money market assets, as of Wednesday last week, had risen to $3.62 trillion – the highest since July 2009. On a four-week basis, these assets stood at $3.58 trillion (Chart 3).
Particularly since May this year, the green bars in the chart have gone parabolic (arrow), up north of $500 billion. The buildup has occurred even as the S&P 500, and other major indices, has rallied to new – and newer – highs. Bulls hope at least a decent amount of this cash moves into equities, providing a further boost to prices. Time will tell. Thus far, these two metrics have diverged.
There was a similar divergence between the S&P 500 and foreigners’ purchases – or a lack thereof – of US equities (more on this here). In the last several months, however, foreigners have substantially reduced their selling. This has helped equity bulls. Of late, help has also come from a rather unexpected source.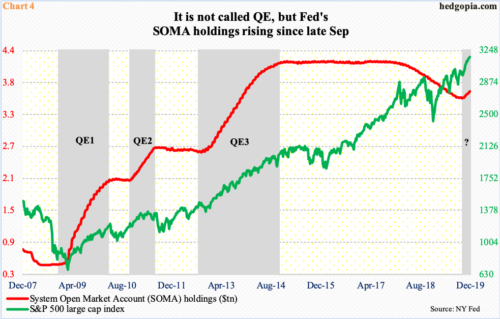
The Federal Reserve’s SOMA (System Open Market Account) holdings are once again rising. Since bottoming 12 weeks ago at $3.55 trillion, they have gone up by $130.1 billion, to $3.68 trillion. This preceded a drop of $688 billion beginning April 2017, when the Fed began to scale back its massive holdings of Treasury and mortgage-backed securities it accumulated post-financial crisis. The bank conducted what is known as QE1/2/3 back then (Chart 4).
This time around, toward the end of September, the Fed began injecting capital to solve money-market stresses leading to a spike in short rates. This has added liquidity into the system. The bank currently owns $132 billion in Treasury bills, up from $6 billion two months ago. In other words, the Fed’s balance sheet is in cooperation, making up for shortfalls elsewhere, such as margin debt. As things stand, buybacks and the Fed are the two important pillars of support currently.
Thanks for reading!
