
On Monday, the CBOE equity put-to-call ratio surged to 1.21. Readings north of one are very rare.
Below are the last three times when this occurred and how stocks fared subsequently.
August 21, 2015 (1.04): U.S. stocks were in the midst of a sell-off. The S&P 500 bottomed in the next session, although the lows were retested in September.
August 1, 2014 (1.04): The S&P 500 bottomed four sessions later.
August 19, 2011 (1.03): The S&P 500 bottomed 31 sessions later, although went more or less sideways before it began to rally.
There is a pattern here.
At least going by the last three one-plus readings, the last time the ratio read this high, stocks subsequently rallied.
As if on cue, stocks rallied big on Tuesday, with the S&P 500 gaining one-plus percent.
The bigger question is, is this a prelude to a bigger rally to come?
First of all, the Monday reading of 1.21 came on the heels of three consecutive sessions of readings in the 0.50s. It is not like the bearish sentiment had been gradually building. As a matter of fact, Tuesday produced another 0.50s reading. Four out of five reading in the 0.50s, that is not seeking protection, rather reeks of complacency.
Odds favor Monday’s reading consisted of more protective puts than outright bearish bets.
It is not hard to imagine why investors may be seeking to protect themselves right now.
Stocks are near their highs… December so far has failed to live up to seasonal expectations, with the S&P 500 (2078.36) flat… Since stocks bottomed in late September, fund flows have been a disappointment… Earnings are in deceleration, with 2016 estimates probably elevated… The Fed just hiked, and is bracing for four more quarter-point times next year.
No wonder investor nerves are setting in.
In an ideal world, equity bulls could have used this to their advantage – along the lines of elevated short interest resulting in a squeeze.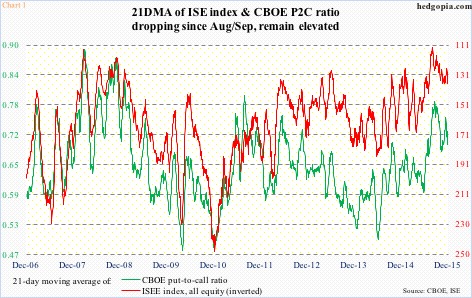
Indeed, if we focus on Chart 1, the green and red lines have been unwinding since August/September, and there is plenty of room left for that to continue.
That said, below are two charts suggesting why this may not happen right away, if at all.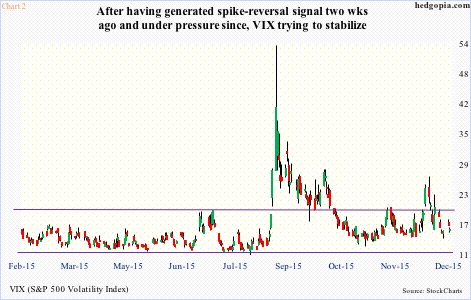
Early this month, spot VIX surged past resistance at 20, only to spike and then reverse (arrow in Chart 2). Stocks rallied as VIX retreated. A drop below 15 was quickly bought on Christmas Eve. It is currently slightly below both its 50- and 200-day moving averages, but on a daily chart looks to be itching to move higher.
Should this materialize, the VIX-to-VXV ratio, which just dipped into oversold zone and is beginning to rise, has tons of room to continue moving higher (Chart 3). This more often than not tends to act as a headwind for stocks.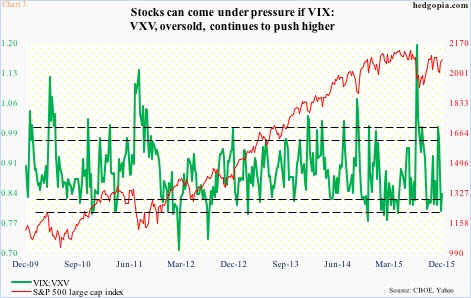
The bottom line: Monday’s put-to-call reading is probably not flashing the go-ahead signal for stocks at this point in time – at least not yet.
Thanks for reading!
