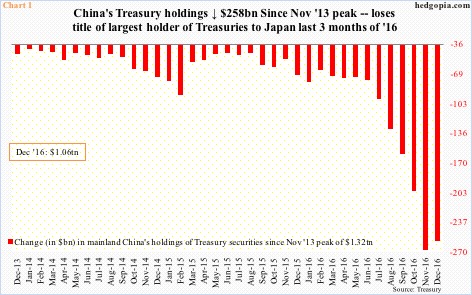
China’s Treasury holdings rose by $9.1 billion month-over-month in December. This comes in the wake of six consecutive months of contraction during which it sold $194.7 billion worth. This was the first monthly increase since last May.
Coincidentally or not, yields on 10-year Treasury notes bottomed at an all-time low 1.34 percent last July, before peaking at 2.62 percent in the middle of December.
China’s holdings are worth paying attention to.
Size-wise, Japan is as big. In fact, until last September, China was ahead of Japan, before losing ground as it continued to cut back holdings. By December, Japan held $1.09 trillion, and China $1.06 trillion. These two are the largest foreign holders of Treasurys.
Together, China and Japan accounted for nearly 36 percent of total foreign holdings in December. Foreigners held $6 trillion in Treasurys. The total peaked in January 2015 at $6.22 trillion; November’s 5.94 trillion was the lowest since then.
As big a factor as foreigners’ holdings are, China’s is a special case.
Its foreign exchange reserves dropped $41.1 billion in December to $3.01 trillion – the lowest since March 2011. It fell by another $12.3 billion in January to just under $3 trillion – $2.998 trillion, to be exact. Reserves reached an all-time high $3.99 trillion in June 2014.
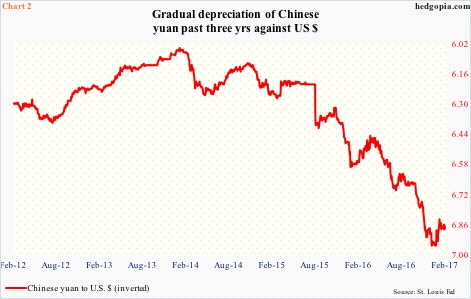
Enter the Chinese yuan. The peak in China’s reserves precedes a peak in the Chinese yuan. On January 14, 2014, a U.S. dollar bought 6.0402 yuan. The latter then went on to weaken to 6.9575 by January 3 this year.
A weaker yuan has resulted in capital outflows, forcing China to dip into its reserves to support the currency. Thus the reduction in Treasury holdings.
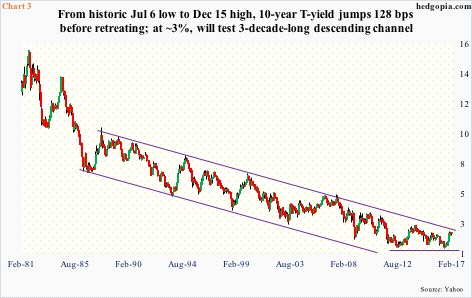
In due course, if the trend persists, this could have repercussions for Chart 3.
Yields on 10-year Treasury notes have been trapped in a descending channel for three decades now. From 15.8 percent in September 1981 to 1.34 percent last July – which successfully tested the then-low 1.39 percent from four years earlier – the 10-year has come a long way.
Post-July 6, 2016 low of 1.34 percent, yields jumped to 2.62 percent by December 15 last year. But the upper end of that channel was not even properly tested, which takes place around three percent. The 10-year is yielding 2.5 percent currently. A convincing breakout – not a base case on this blog currently – will be massively significant.
Can China play a role in this? Potentially. The dynamics among capital outflows/yuan/reserves/Treasurys are real. Last year, the yuan fell 7.2 percent against the greenback, and China sold $188 billion in Treasurys. Hard to imagine a similar back-to-back drop in the currency this year, but just in case there is one, the upper end of the channel in Chart 3 needs monitoring.
Also worth remembering: Japan, too, has been selling. December was the fifth m/m drop. Its holdings peaked at $1.24 trillion in November 2014.
All this is taking place at a time when the Trump administration talks about increased infrastructure spending plus tax cuts.
The U.S. economy is four months short of completing eight years of recovery. The nation still runs a budget deficit. As things stand, its path of least resistance is up. In fact, it is already trending higher.
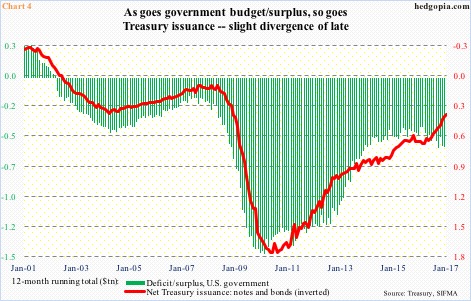
Chart 4 pits the 12-month running total of issuance of Treasury notes and bonds with the federal government’s surplus/deficit. The green bars have been inching higher – from minus $405 billion in January 2016 to minus $580 billion last December. Of late, they have been diverging with Treasury issuance, but the two track each other well. Higher deficit will entail higher issuance, which can put upward pressure on long rates.
All the more reason to keep an eye out for China’s Treasury holdings.
Thanks for reading!

