
In markets, rarely does everything move in sync. Some jig, some jag. Some lead, some lag. That is the nature of the beast. But there is something called divergence, which, if it is so stark it is hard to miss, is worth taking notice.
The S&P 500 large cap index (2075.15) is on fire. That is an understatement. Since the intra-day low on September 29 through last Friday’s close, it is now up just under 11 percent (Chart 1). That is in 18 sessions! Of course, it preceded the five-day, 11-percent decline leading to the August 26th low, the rather sharp reversal has taken even the bulls by surprise, let alone shorts.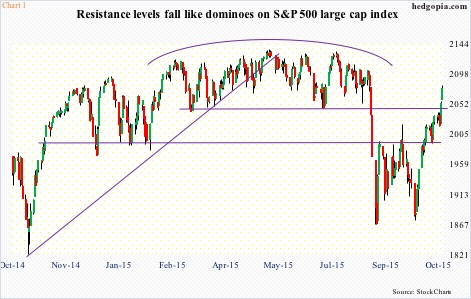
With the recent rally, the S&P 500 has now recaptured both 50- and 200-day moving averages, with the former in particular no longer falling. Thus far, the index has retraced 75 percent of the May-August decline. The all-time high of 2134.72 is less than three percent away.
Over on the Nasdaq 100 (4624.09), the all-time high of 4694.13 (notched in July this year) is a mere 1.5 percent away (Chart 2). Off the August low, the tech-heavy index is up 22 percent. In two months! Last week alone, propelled by post-earnings rallies by MSFT, GOOGL, AMZN, and TXN, it shot up 4.2 percent. There are breakouts galore. As is the case with the S&P 500, the Nasdaq 100 has reclaimed both 50- and 200-day moving averages, with both beginning to go sideways/slightly curl up.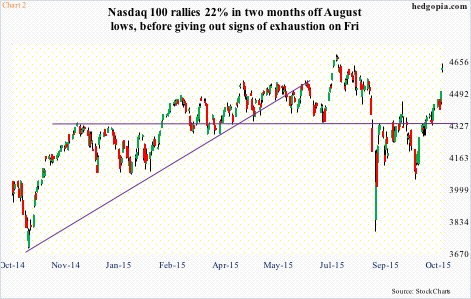
One catalyst for the move has been 3Q earnings. Not only are good results being rewarded handsomely (the four tech names above, for example), but post-earnings weakness is being bought (think of financials, such as JPM and GS).
Going into the reporting season, estimates were revised downward heavily. At the end of September, 3Q15 operating earnings estimates of S&P 500 companies were $28.61, down from $31 as early as February this year. Three more weeks (as of October 22nd), and estimates have gone down by another $0.33, to $28.28.
Estimates for 2015 are now at $109.95, down from $137.52 at the end of June last year; 2016 is under pressure as well, but is still expected to grow nearly 16 percent over this year (Chart 3)! On a trailing four-quarter basis, earnings peaked at $114.51 in 3Q14, dropping to $106.99 in 3Q15 – for a trailing P/E of 18.8x.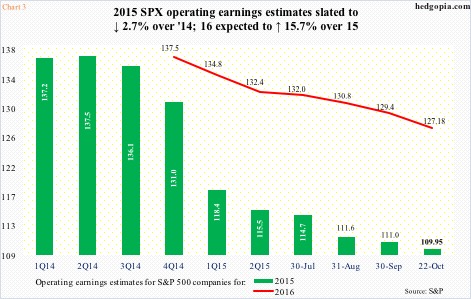
Valuations are a tricky thing. They can keep getting stretched as long as buyers have the wherewithal and are excited to get in. The latest reason to get excited came via two central banks.
On Thursday, Mario Draghi, ECB president, said the bank is prepared to provide additional stimulus to raise inflation to its target, probably as soon as December. The ECB currently buys €60 billion/month in assets, primarily government bonds; the program runs through September next year. Then on Friday, the People’s Bank of China cut its benchmark lending rate and reserve requirements for banks. The thought of more liquidity is too alluring! On Thursday and Friday, the S&P 500 rallied 2.8 percent, and the Nasdaq 100 4.8 percent.
There is excitement in the air.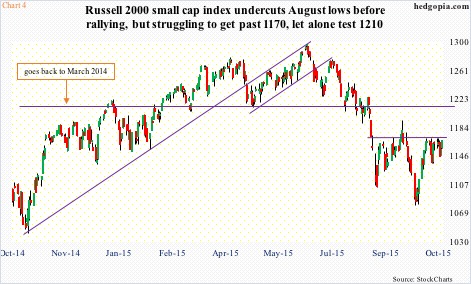
Unless one looks toward how small-caps are faring. Last week, the Russell 2000 small cap index (1166.06) was up a tiny 0.3 percent. In September, it was the only major index to have undercut the August lows (Chart 4). The subsequent rally has it struggling at 1170, and has a long way to go before it approaches major resistance at 1210, an important price point going back to March 2014. Unlike the S&P 500 and the Nasdaq 100, the Russell 2000 is 4.3 percent away from its 200-day moving average. A substantial underperformance!
The S&P 400 mid cap index (1439.84) is not faring any better (Chart 5). As a matter of fact, there are similarities between it and the Russell 2000. It too is struggling at minor resistance before testing a major one at 1450-ish. It too is substantially below its 200-day moving average, which is 3.1-percent away. And last but not the least, it too undercut the August lows, albeit ever so slightly.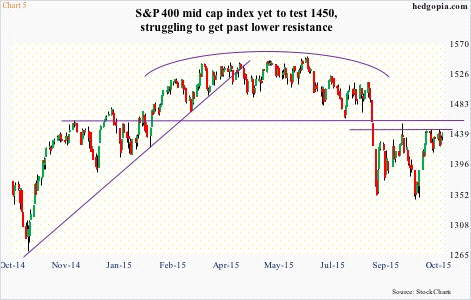
What is the message coming out of these two – the Russell 2000 and the S&P 400? Why are they not participating in the rally the way large-caps are? It is prudent not to read too much into this, but it is also prudent not to ignore this completely.
In the best case scenario for the bulls, money will soon begin to rotate out of large-caps and into small- and mid-caps. In this scenario, the Russell 2000 and the S&P 400 get a bidding here and in due course take out resistance at 1170 and 1445, respectively.
The odds of large-caps coming under pressure near-term are decent. Both the S&P 500 and the Nasdaq 100 are way overbought, with the latter in particular having produced a doji on Friday, right on top of the upper Bollinger band. A doji could also be seen on SPY, the SPDR S&P 500 ETF.
Once again, it is all good if money leaving large caps finds a home in mid- and small-caps.
The worst-case scenario? Large-caps come under pressure, dragging the hitherto laggards mid- and small-caps along.
Thanks for reading!
