
In the past year and a half, crude oil has gone through a lot.
It is not often a commodity of oil’s significance drops 61 percent in nine months. Yet that is what happened to spot West Texas Intermediate crude between June last year and March this year.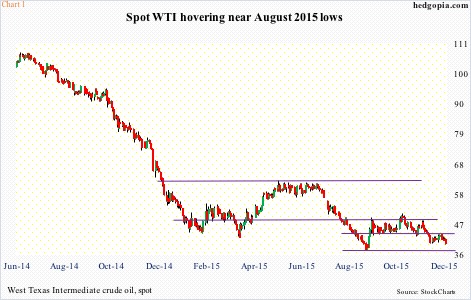
Subsequent to that low, the crude did rally nearly 48 percent, but only to come under renewed pressure and undercut the March low in August. It has been hovering near those lows for three months now (Chart 1).
Oil’s collapse has reverberated through the U.S. economy, corporate earnings, and capital expenditures, among others. Rig counts have been a prominent casualty.
North American oil rig counts peaked at 1,609 in October last year. This preceded a parabolic rise from 179 in June 2009. The decline since that October peak has been brutal. As of November 27th, rig counts stood at 555 – down nearly 66 percent in 11 months (Chart 2).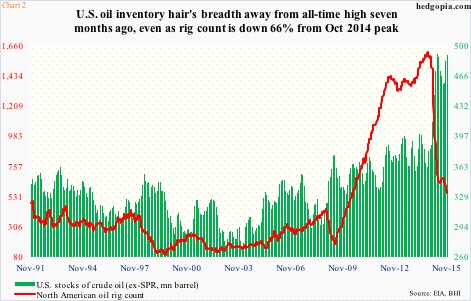
Ordinarily, one would think a collapse of this magnitude would impact crude production as well as inventory. Not this time.
Chart 2 also plots U.S. stocks of crude oil, and they are near all-time highs.
As of November 27th, crude inventory was 489.4 million barrels, up 961,000 barrels week-over-week – just a stone’s throw away from the April 24th all-time high of 490.9 million barrels.
In fact, this was the 10th straight weekly increase in stocks, which earlier dipped to 450.8 million barrels in the August 21st week. The gradual increase has resulted in the four-week rolling average coming back to life again (Chart 3). The chart also plots production of crude oil, which has declined in recent weeks, but from a very elevated level.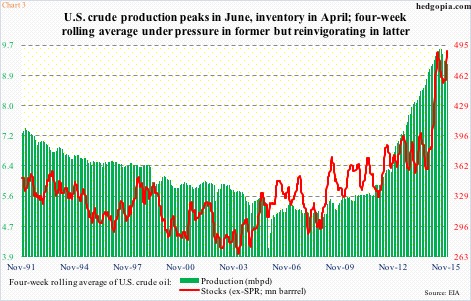
Back on October 10th, when oil rig counts peaked at 1,609, crude production was 8.95 million barrels per day. As stated earlier, rig counts have declined by two-thirds. In the meantime, production has risen to 9.2 million barrels per day. As a matter of fact, it rose all the way to 9.61 million barrels per day in the June 5th week.
So consider this. WTI price is down 62 percent since last June, rig counts are down 66 percent from last October, yet crude stocks are near all-time highs and production is not that far away from all-time highs.
While on the one hand this is testament to shale oil’s resilience, on the other this shows Saudi Arabia-dominated OPEC’s intention of harming competition is yet to bear fruit. Bruised and battered, shale oil is hanging in there.
One year ago, Saudi Arabia resisted production cuts to support prices, leading to a collapse in oil price. This time around, ahead of the meeting, no one expected a change in the status quo. The past couple of days, however, the rumor mill has gotten active, suggesting that nation will next year propose a deal to balance the market with non-OPEC help.
We will learn about OPEC’s decision later today.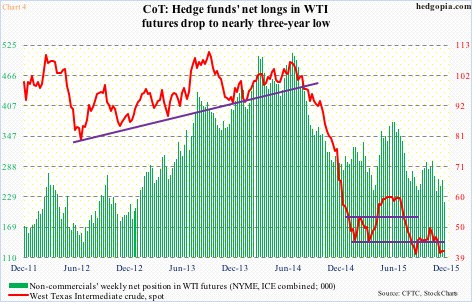
If the rumor is right and there is indeed a change in policy, that would come as a surprise… and probably a relief to shale oil. This would also fly in the face of what the Saudis have been saying all along. It is hard to see why they would do that.
In the futures market, non-commercials are not positioned for this scenario. They are still net long WTI futures, but have been cutting back since May this year (Chart 4). As of Tuesday last week, they held 218,745 contracts – the lowest since December 2012.
Yesterday, the WTI ($41.27) rallied responding to the said rumor as well as a weak dollar. For a sustained move higher, fundamentals need to do a U-turn. Stockpiles around the world and the U.S. have continued to rise.
Hence the significance of what comes of the OPEC meeting.
Even under the most optimistic scenario, resistance on spot WTI is galore – $44, followed by $48 and then $62 (Chart 1).
Thanks for reading!
