
After the October-December rout, US stocks rallied big in January and February-to-date. Several data points such as consumer and investor sentiment followed suit, but their rise has been muted. For longs, this could mean there is room for more strength, while for shorts this diminished enthusiasm could signal renewed weakness ahead.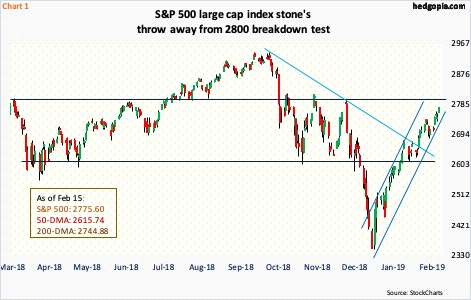
US stocks exploded out of the 2019 starting blocks. Year-to-date, the S&P 500 large cap index is up 10.7 percent. We are a month and a half into the year! From the December 26 low, it is up 18.3 percent. This preceded a 20.2-percent decline that began on October 3.
During that 13-week decline, one after another support gave way. Bears were crushing it. The recovery since late December has been no less impressive. Bulls deserve kudos. They not only recaptured the 50-day moving average plus 2600-2630 but also the 200-day, which was retaken last week. The index (2775.60) is now within striking distance of 2800 (Chart 3).
For most of last year, the S&P 500 bounced up and down between 2800 and 2600. After the selloff began early October, sellers showed up at that resistance three times in the next couple of months – mid-October, early November and early December. This level is worth watching – particularly considering how overbought prevailing conditions are.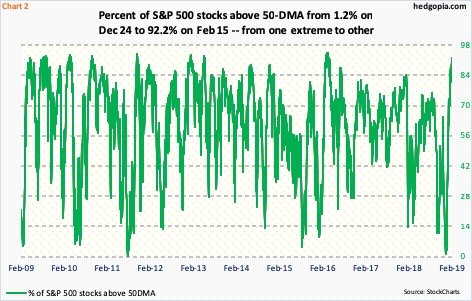
The percent of S&P 500 stocks above the 50-day has gone from one extreme to the other – in no time. Back on December 24, this metric dropped to 1.2 percent, which was the lowest since August 2011. This, along with several other oversold indicators at the time, paved the way for the rally that began late December. Now, the pendulum has swung the other way.
Last Friday, 92.2 percent of S&P 500 stocks were above their 50-day. This was the highest reading since early April 2016. As Chart 2 shows, once things get this high, it is nowhere to go but down.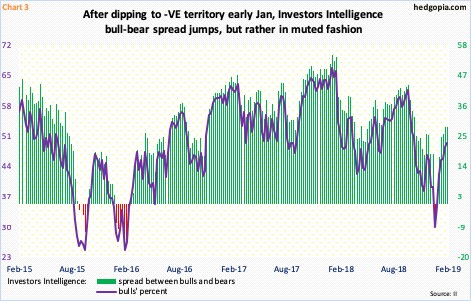
The rally in stocks the past month and a half has been accompanied by improvement in several indicators.
In the week ended early January, Investors Intelligence bulls were 29.9 percent. This was the lowest since mid-February 2016, when stocks reached a major bottom. This time around, in the six weeks since the January low, bulls rose every week, to 49.5 percent last week.
The latest bull-bear spread was 28, versus minus 4.7 early January (Chart 3). For reference, early October when stocks began to fall apart the spread was 43.2. Bulls back then were 61.8 percent. Stocks have massively rallied since the late-December low, but bulls’ count is nowhere as optimistic. What does this imply? That likely depends on who is answering. For bulls, this is a sign that there is room for continued strength. Bears, on the other hand, will argue that the lack of enthusiasm suggests renewed weakness ahead.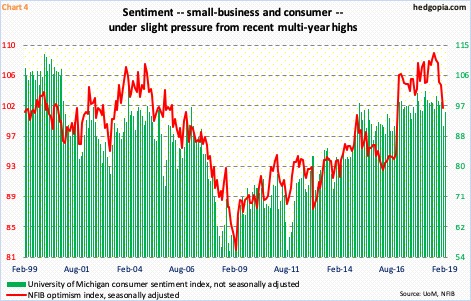
This is evident is several other data points.
Chart 4 plots the NFIB optimism index with University of Michigan’s consumer sentiment index. They tend to follow each other.
Last year, they both reached multiyear highs – small-business optimism at 108.8 in August and consumer sentiment at 101.4 in March – with the latter rising 4.3 points month-over-month in February (preliminary) to 95.5 and the former falling 3.2 points m/m in January to 101.2.
The rebound in consumer sentiment came after the government shutdown ended and after the Fed signaled it would hold off on interest-rate hikes. They both took place late January. The February bump in consumer sentiment reflects this. Hence the significance of how optimistic – or a lack thereof – small businesses feel in February.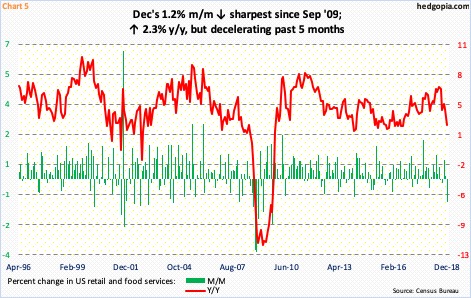
In this respect, January’s retail sales are equally worth watching. December was ugly. Sales were down 1.2 percent m/m in that month – the sharpest drop since September 2009 (Chart 5). In the 12 months to December, sales rose 2.3 percent to a seasonally adjusted annual rate of $505.8 billion, but growth is rapidly decelerating; as recently as July last year, sales increased at a 6.6-percent pace.
There are many factors driving consumer spending, not the least of which are wage growth and the wealth effect. As stocks tumbled in October-December, this likely impacted consumer spending – also reflected in the 7.1-point m/m decline in consumer sentiment in December (Chart 4). The S&P 500 took it on the chin in that month (Chart 1). The index jumped 7.9 percent in January, so this should buoy sentiment, and by default, retail sales. A lack thereof can be interpreted by markets as something is amiss. Overbought stocks will not like this.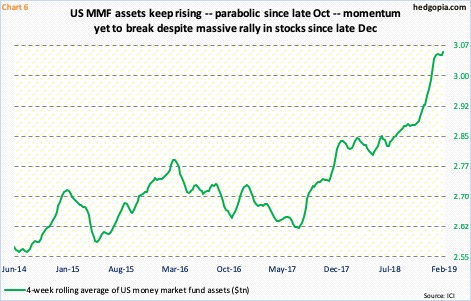
If data, including retail sales, improve, however, a case can be made that equities would begin to attract at least some of the funds that are accumulating in money-market funds. This is what bulls are hoping would happen.
In the week ended October 3 last year, these funds held $2.87 trillion. That was when stocks peaked. Last week, they held $3.08 trillion. Since the week ended December 26, which is when the S&P 500 bottomed, assets have grown by $41 billion.
The parabolic growth in money-market funds since late October is reflected in Chart 6, which uses a four-week rolling average. Once again, depending on one’s bias, this can be viewed in a positive or negative light. That stocks rallied without much help from these funds can suggest bulls are approaching the end of the rope. At the same time, there is a lot of potential dry powder in these funds. Hence the significance of data such as retail sales in January and February.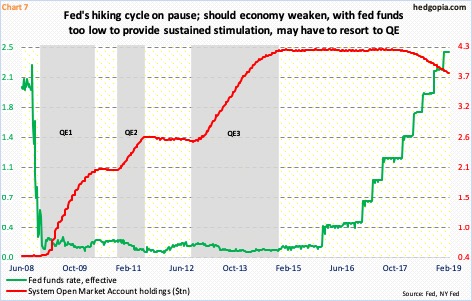
Continued deceleration in macro data would seriously begin to poke a hole in the thesis that it is all hunky-dory, which is what the year-to-date surge in stocks is pricing in. Stocks also got a lift as the Fed essentially went on the sidelines for now. This comes after nine 25-basis-point hikes in the fed funds rate since December 2015, to a range of 225 to 250 basis points (Chart 7).
The Fed would not want macro weakness right here. It obviously wants to see how the recent deceleration shakes out. But its conventional monetary quiver does not have enough arrows. For it to reload, the economy needs to regain momentum. Else, it may have to go back to unconventional quantitative easing. This is a medium- to long-term risk. Near term, the issue is if upcoming data support the January-February surge in stocks. We will begin to get a sense of this in the session ahead depending on if bulls or bears prevail at/around 2800 on the S&P 500.
Thanks for reading!
