What is going on in the jobs market the past several months is reviving hopes that better days are ahead.
 There is a lot we can point to in order to validate how anemic the recovery has been post-Great Recession. Real average hourly earnings of U.S. employees were $10.03 in December 2007 (that was the month the National Bureau of Economic Research) marked as the start of the last recession) and have barely grown since; by June, earnings had inched up to $10.28. Real disposable personal income (per capita) was $35.9k back then versus $37.2k in May. Industrial capacity utilization was 80.8 percent then, versus 79.1 percent in June. Labor’s share in national income was 64.4 percent in 4Q07 vs. 61.7 percent in 1Q14. The U.S. home ownership rate was 67.8 percent in 4Q07 versus 64.7 percent in 2Q14. And on and on. Several data points are in dire need of recovery in this recovery. Even on the jobs front, things have been rather slow going. It took 77 months before the January 2008 peak in non-farm payroll (138.4mn) was surpassed (July was 139mn). But the trend is headed the right direction. Or so it seems. The first seven months of the year has produced 1.5mn non-farm jobs, at an average of 220k. And the JOLTS survey continues to perk up.
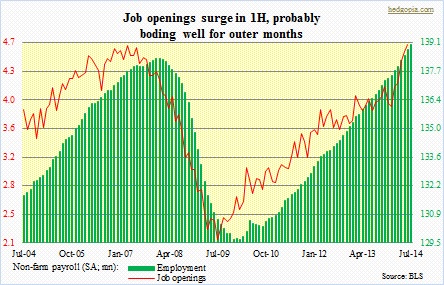
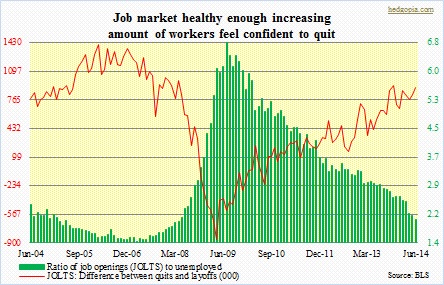
 June’s numbers were published yesterday, and the momentum continues. The spike in job openings since the beginning of the year can be seen in the chart above. These two series – job openings and non-farm payroll – tend to track each other, with the former leading the latter by about six months. So if this relationship holds, there are several more months of decent job creation ahead. In the month, the number of unemployed workers per job opening dropped to 2.03 – the lowest since April 2008. In July 2009, this had risen to as high as 6.8 – that is nearly seven unemployed vying for an opening! So the progress is undeniable. It is just that the magnitude (of progress) is anything but. Another way of looking at this issue is the quits rate, which essentially measures workers’ confidence in finding a new job. The 2.53mn number in June is the highest since June 2008. At the same time, layoffs and discharges have been fewer and fewer – 1.62mn in June versus 2.59mn in April 2009. As a result, in the accompanying chart, the red line since the middle of 2009 has been trending from the lower left to the upper right.
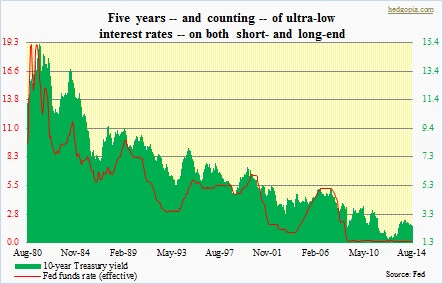
Apparently, the JOLTS survey is one of those data points closely watched by Fed Chair Janet Yellen. If, as they have in the past, job openings do indeed lead non-farm payroll, then that will bring the issue of when to raise rates front-and-center. Markets currently anticipate the Fed to start raising toward the middle of next year. But could persistent improvement in the jobs picture force the Fed’s hand sooner? Then there is the issue of the signal coming out of the bond market, which continues to attract buyers. The bond vigilantes do not seem to believe in the sustainability of the current trend in jobs. Here is an alternative scenario. The current pace in job creation continues. The Fed acts sooner than later. And that in and of itself will cut short the life of recovery. The reason why the bond market is treating all this with a big yawn. More often than not, they get it right. 

