
Stocks of major U.S. banks and brokers are behaving in a way that shorts are probably not very happy with. Should they treat this as a signal or noise?
The top six have reported September-quarter results, and it is a mixed bag on the bottom line, and a disappointment on the top.
JPMorgan Chase (JPM), Goldman Sachs (GS), and Morgan Stanley (MS) missed on the bottom line. Wells Fargo (WFC), Bank of America (BAC) and Citibank (C) beat. They all struggled on top-line growth.
In fact, of the four major banks, WFC was the only one to have grown revenue year-over-year, though ever so slightly – from $21.2 billion last year to $21.9 billion. JPM reported $22.8 billion (versus $24.5 billion last year), C $18.7 billion (versus $19.7 billion), and BAC $20.7 billion (versus $21.2 billion).
Post-earnings, five of these stocks are higher. Investors/traders reacted positively to the results of BAC, C, and WFC right from the word go. GS staged an intra-day reversal shaking off early weakness, while JPM dropped in the session earnings were reported, but rallied in the subsequent sessions. MS is still down.
Bad results are not keeping these stocks down, even as the good ones are being embraced. Bulls could not be asking for more.
One probable reason for this behavior is the perception in the market place that higher rates are good for the banks. Jamie Dimon, JPM CEO, was on Bloomberg TV the other day essentially urging the Fed to raise rates. In ordinary circumstances, a higher rate would help. The Fed begins to tighten as it is convinced that the economy is on a self-sustaining path. The yield curve steepens. Spreads – banks’ bread and butter – widen. And stocks react – positively.
Here is a counterargument to that line of thinking.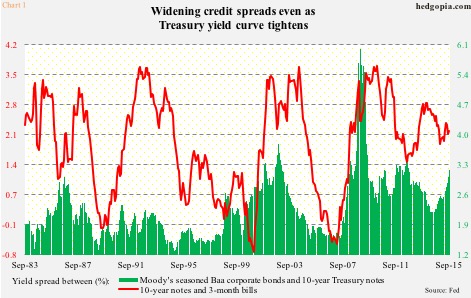
This is not any Tom, Dick, and Harry cycle. The Fed acts like it seriously wants to begin to tighten, but economic data continue to come in mixed at best. Rates are still zero-bound. It is entirely possible when the first rate hike finally happens – whenever that is – the long end of the curve does not cooperate. So rather than steepening, the yield curve tightens. Not an ideal scenario for entities that borrow short and lend long.
In Chart 1, the spread between 10- and three-year Treasury yields has been making lower highs for nearly five years now. Year-to-date, the spread is essentially unchanged at 2.15 percent. On the other hand, the spread between yields on 10-year Treasury notes and Moody’s Baa corporate bonds has been rising – from 2.53 percent last December to 3.17 percent in September. In December, these corporate bonds were yielding 4.74 percent, rising to 5.34 percent by September. This is not a confidence-booster. The long end of the Treasury yield curve continues to act worried.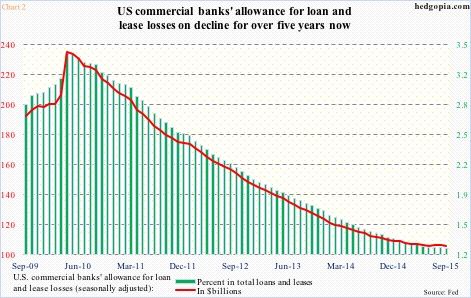
This view is totally contradicted if we focus on what banks are setting aside in reserves. U.S. commercials banks’ allowance for loan and lease losses was $106.1 billion in September, which not surprisingly has persistently dropped as the economic recovery matured. In April 2010, these allowances totaled $235.3 billion (Chart 2). At the time, this equaled 3.4 percent of total loans and leases ($6.9 trillion), dropping to 1.26 percent this September (loans and leases of $8.4 trillion).
This becomes a moot issue if macro data begin to improve enough the Fed feels comfortable raising the fed funds rate, followed by a steepening in the yield curve.
Does the bond market believe in this scenario currently? Probably not. The way the long end of the curve is behaving speaks volumes.
In this respect, how financials act in the very near future has potential to be another big tell.
XLF, the SPDR Financial ETF, is dominated by big-cap financials. Its top five holdings include Berkshire Hathway (BRK.B), 8.6 percent; WFC, 8.5 percent; JPM, 7.9 percent; BAC, 5.8 percent; and C, 5.4 percent.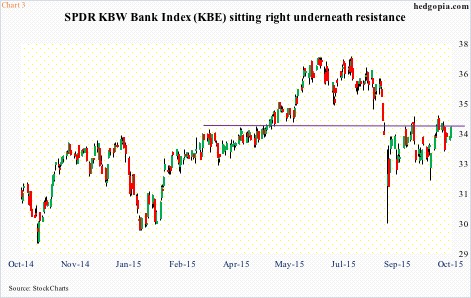
For our purposes here, XLF suits better than KBE, the SPDR KBW Bank ETF. The latter is dominated by regional banks, accounting for nearly 78 percent. At 1.8 percent, its top weight goes to First Niagara Financial Group (FNFG). C has only been given 1.64 percent weighting, BAC 1.59 percent, WFC 1.58 percent, and JPM 1.57 percent. This is the reason why KBE acts like KRE, the SPDR KBW Regional Banking ETF.
With that said, both XLF and KBE are approaching crucial resistance. KBE is sitting right on $34, which has proven to be an important price point of duel between bulls and bears going back to March last year (Chart 3). On Tuesday, it pushed above its 200-day moving average.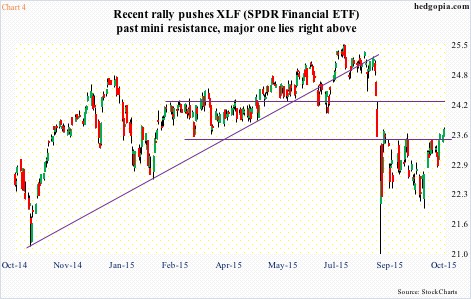
Similarly, XLF faces major resistance at $24-ish. The ETF is above mini-resistance at $23.50, as well as its 50-day moving average, but a major one lies right above. Resistance goes back to November last year (Chart 4). As well, the 200-day moving average lies at $24.02.
If the post-earnings price action by big banks and brokers is genuine, then XLF should be able to break out of this resistance sooner than later. Although, at least near-term, the odds do not look good, given how stretched daily conditions are.
Given this, it is tempting to sell XLF naked calls to possibly go short near that resistance, but there is not much premium. Weekly October 30th 24 calls only fetch $0.10. The only option is to go short the ETF. Wait and watch for now.
Thanks for reading!
