Stocks rallied strong on Monday and Tuesday, and Wednesday’s weakness was bought. Digestion of these gains is possible near term. Medium- to long-term, sentiment remains very suppressed.

Some rally that was! From last Friday’s close through Tuesday’s high, the S&P 500 jumped 6.2 percent. That is in a couple of sessions!
Of course, this preceded a 25.6-percent tumble from January’s record high 4819. As a matter of fact, last week closed with Friday’s breach of the mid-June lows at 3630s, raising bears’ hopes of further downside pressure.
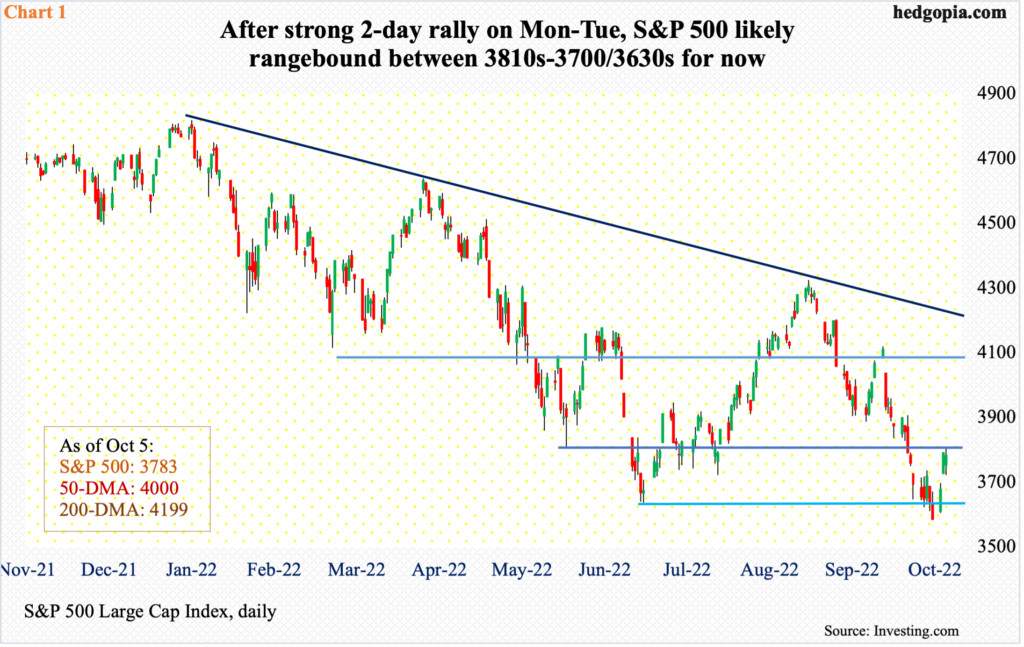
But then, as soon as October began, sentiment did a U-turn. Monday, bulls rallied the large cap index 2.6 percent. Tuesday, it gapped up to close up 3.1 percent. Wednesday, the index was down 1.8 percent intraday before bids began to show up just north of 3700, rallying to only close lower 0.2 percent.
Wednesday’s high of 3807 was essentially a test of horizontal resistance at 3810s (Chart 1), and it held. For now, if nothing else just to digest the gains of Monday and Tuesday, the S&P 500 could very well play ping pong between this level and 3700, or even 3630s.

Medium- to long-term, sentiment continues to remain suppressed, and, from bulls’ perspective, that is a good thing from a contrarian standpoint.
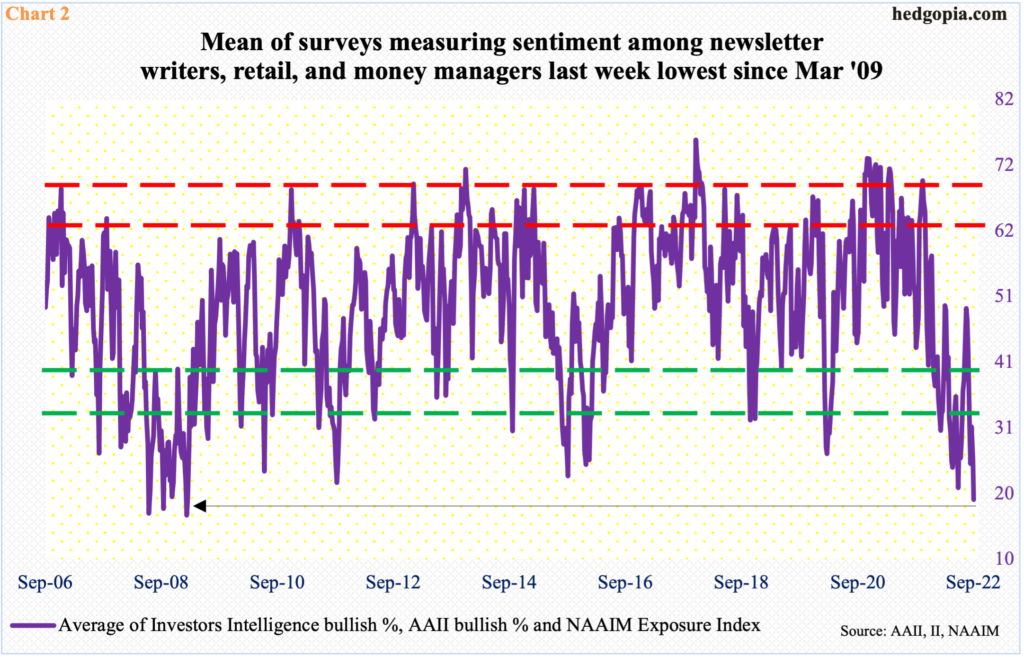
Chart 2 calculates an average of Investors Intelligence bullish percent, American Association of Individual Investors (AAII) bullish percent, and the NAAIM Exposure Index. Of the three, Investors Intelligence is a survey of newsletter writers, AAII is retail-oriented, while the National Association of Active Investment Managers (NAAIM) index represents members’ average exposure to US equity markets.
Last week’s reading was 19.3, with Investors Intelligence bulls at 25.4 percent (lowest since February 2016), AAII bulls at 20 percent (prior week’s 17.7 percent lowest since April this year) and the NAAIM index at 12.6 (lowest since March 2020). The average has never been this low since March 2009.
Thanks for reading!

