
Of late, U.S. economic data have been coming in better than expected. Is this getting translated into better corporate sales and earnings?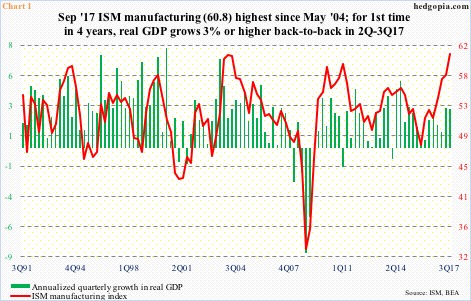
The Citi Economic Surprise Index has shot up from -80 in the middle of the year to 56.
In 3Q17, real GDP grew at a seasonally adjusted annual rate of three percent. This follows expansion of 3.1 percent in 2Q17. This was the first time since 2Q14-3Q14 that the economy put up three-percent-or-higher growth in back-to-back quarters (Chart 1).
Manufacturing activity similarly is at multi-year highs. The ISM manufacturing index fell 2.1 points month-over-month in October to 58.7. But September’s 60.8 was the highest since 61.4 in May 2004.
Things are humming along.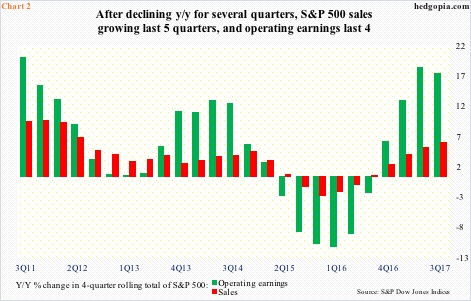
Focusing on S&P 500 companies for our purposes here, sales have been growing at a respectable pace. With 94 percent reporting, 3Q17 sales are on pace to grow six percent year-over-year to $308.19 per share. Using four-quarter rolling total, 3Q17 sales are $1,203.07, up 5.7 percent y/y. This was the fifth consecutive quarter of positive growth, following contraction in prior four (Chart 2).
A similar trend is seen in operating earnings.
As of last Thursday, on a blended basis, these companies were on course for earning $31.57 in 3Q17.
As is the case with sales, using four-quarter rolling total, y/y growth in operating earnings has picked up momentum – from 5.8 percent in 4Q16 to 17.1 percent in 3Q17, although with slight deceleration from 18.1 percent in 2Q17.
Therein lies the rub. In Chart 2, the green bar has downshifted a bit in 3Q17. In fact, using absolute numbers, earnings grew 10 percent y/y in 3Q17, which looks healthy but has substantially decelerated from 21 percent in 4Q16 (not shown here).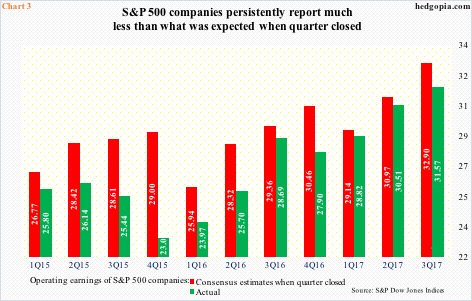
Already, the revision trend is anything but reassuring.
Chart 3 plots two bars for each quarter, going back to 1Q15 – one representing actual operating earnings and the other what the sell-side was expecting when the quarter in question came to a close. For instance, 2Q17 consensus was $30.97 at the end of June; when it was all said and one, these companies earned $30.51.
In the chart, the red bars are always taller than the green ones. In other words, the sell-side always expected better earnings right before the earnings season began, only to revise them lower.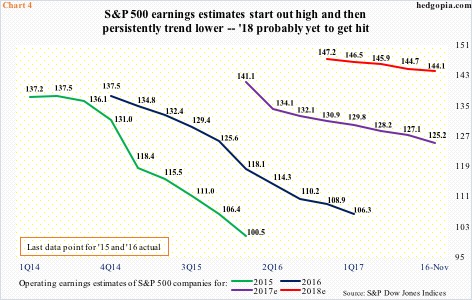
In 3Q17, the delta between the bars in Chart 3 widened – $32.90 was expected, and looks like they will earn $31.57.
The question is, is this the beginning of a trend or merely reflects the fact that the sell-side habitually starts out with unreasonably high expectations before gradually lowering them?
This is particularly important considering how elevated 2018 estimates look.
As things stand, 2018 operating earnings are expected to grow 15.1 percent, following 17.8-percent growth this year (assuming 4Q17 expectations for $34.25 are met).
More important, compare the revision path for 2018 with that of 2015-2017. Next year’s has gone from $147.21 this January to $144.10, but the curve is nowhere near as downward sloping as is the case with 2015-2017. In all likelihood, it is coming. This is not only because the sell-side’s out-of-the-gate estimates tend to be rosy, but also because economic activity can only expand so much.
Manufacturing is already at a 13-year high. Prior spikes north of 60 have proven to be difficult to sustain (Chart 1). Earnings will follow. Just the nature of things.
Thanks for reading!
