
The Nasdaq 100 is itching to break out, even as the Russell 2000 is on the verge of a breakdown. Small-caps have a larger exposure to the domestic economy and hence could be sending a message. Optimistic sell-side estimates for small-caps do not reflect this. When it is all said done, odds favor tech/large-caps will follow small-caps lower in the months and quarters ahead.
With a week to go, March has been very good for tech bulls. The Nasdaq 100 is up six percent month-to-date. This compares with the S&P 500 large cap index which is essentially unchanged for the month and the Russell 2000 small cap index which is down 8.5 percent.
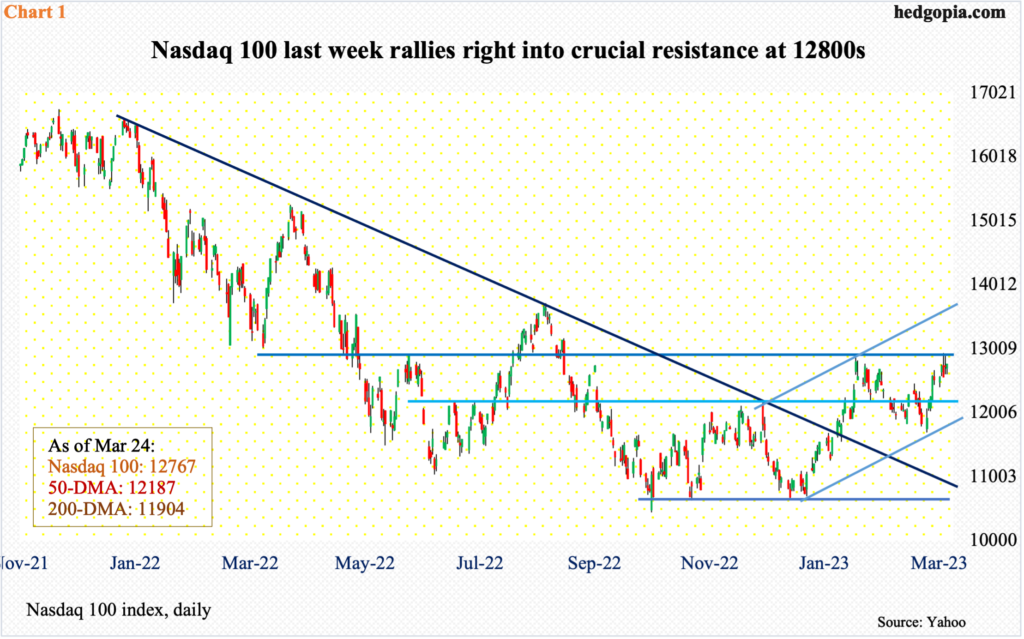
As did the other two indices, the Nasdaq 100 bottomed last October and began to seriously lift as soon as the new year began. As a matter of fact, the tech-heavy index is now caught in an ascending channel that originated on that low. The upper end of the channel lies around 13800 (Chart 1).
A test of the channel resistance in question is only possible once 12800s gives way. Bulls hammered on this several times last week, closing out the week essentially right on it. The tech-heavy index closed Friday at 12767, with both Wednesday and Thursday crossing 12900 intraday.
Going back to December 2020, 12800s has proven to be an area of interest for both bulls and bears. In February, the level was tested, but only to attract bears in droves, ending the month in a gravestone doji. March can end differently, but the daily in the meantime looks to be wanting to go lower.
In ideal circumstances, the index goes lower in the sessions ahead, tests lower/nearest support at 12200s, which coincides with the now-rising 50-day (12187) as well as the channel support, and regroups to once again hammer on 12800s.
No such luck for the small-caps!
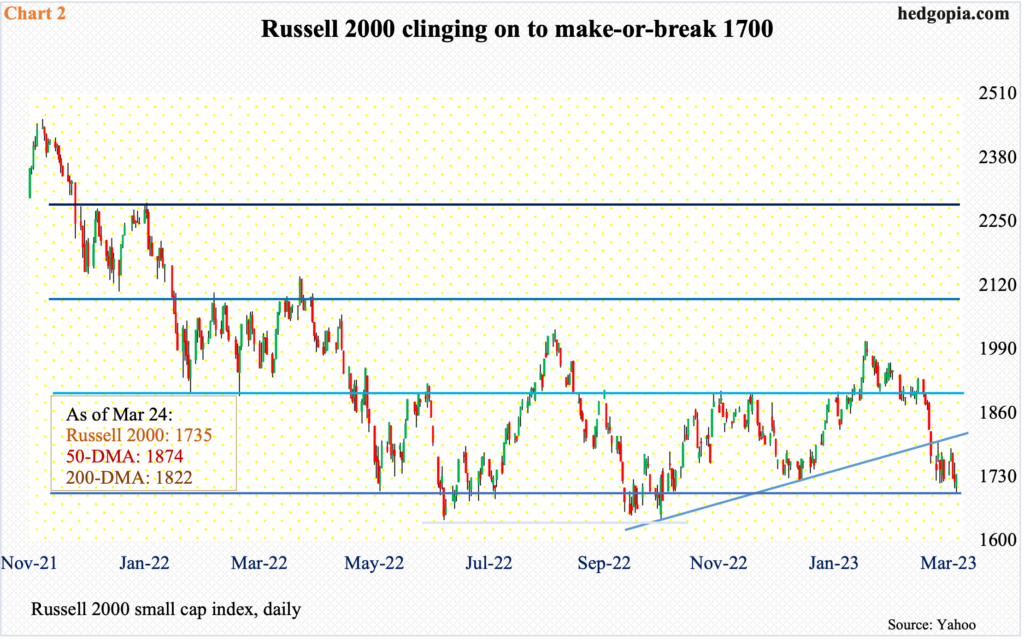
March-to-date, the Russell 2000 is down 8.5 percent and teetering on support. Horizontal support at 1700 goes back to August 2018. The small cap index broke out of it in November 2020 – on the way to recording a new high 2459 in November 2021, before the bears took over.
By last May, 1700 was tested but held. Come June and October, it gave way but only briefly as the bulls defended 1640s on both occasions.
Last Friday, 1695 was ticked intraday before generating buying interest, closing out the week at 1735 (Chart 2). Even if a breakdown occurs, it is likely the longs succeed in defending 1640s. That said, it increasingly feels like it is only a matter of time before 1700 gives way decisively.
Should things evolve this way, this will have negative connotations for the macro economy. Small-caps inherently have a large exposure to the domestic economy. In the event the economy’s prospects are viewed with optimism, small-caps are treated as one of the ways to play risk-on – which is not the case right now.
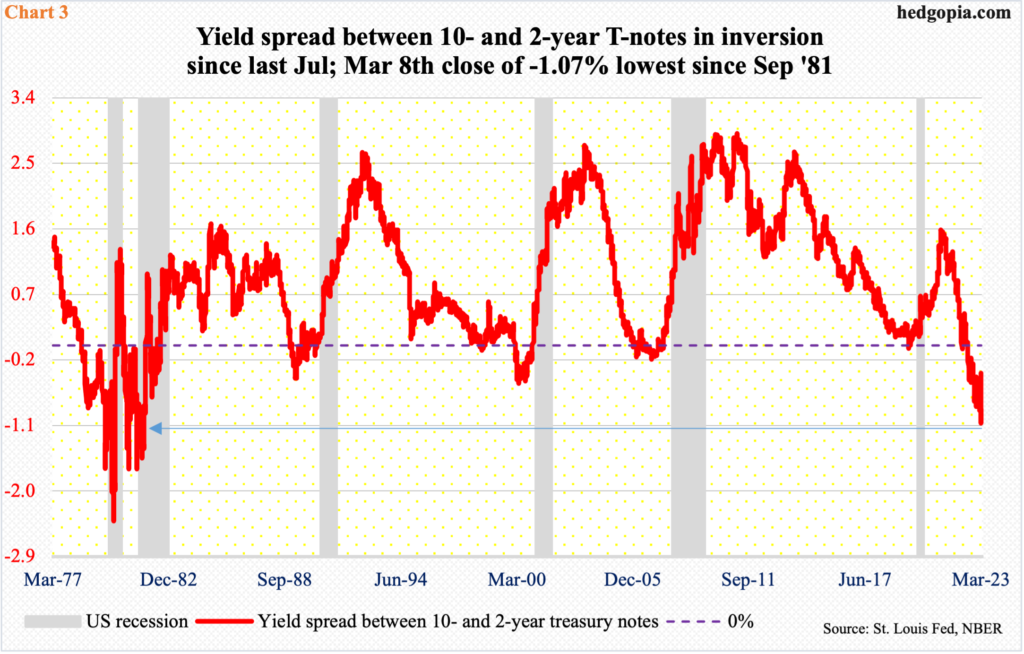
Small-caps’ poor performance comes at a time when the treasury yield curve continues to send warning signs. The yield spread between the 10- and two-year treasury notes has inverted since last July.
The two-year T-yield, which tends to be the most sensitive to the Federal Reserve’s monetary policy, swooned from 5.05 percent on the 8th to last Friday’s 3.76 percent. The 10-year yield went from 4.02 percent (intraday) on the 9th to Friday’s low of three percent, with a close of 3.38 percent.
On the 8th, the 10s/2s spread widened to minus 107 basis points, which was the widest since September 1981 (Chart 3). By last Friday, this had narrowed to 38 basis points, but the fact remains that the curve has been in inversion for simply too long and is foreboding tough times ahead.
If the message from small-caps and the inverted yield curve holds true, then tech sooner or later will tumble. This will then drag the large-caps lower.
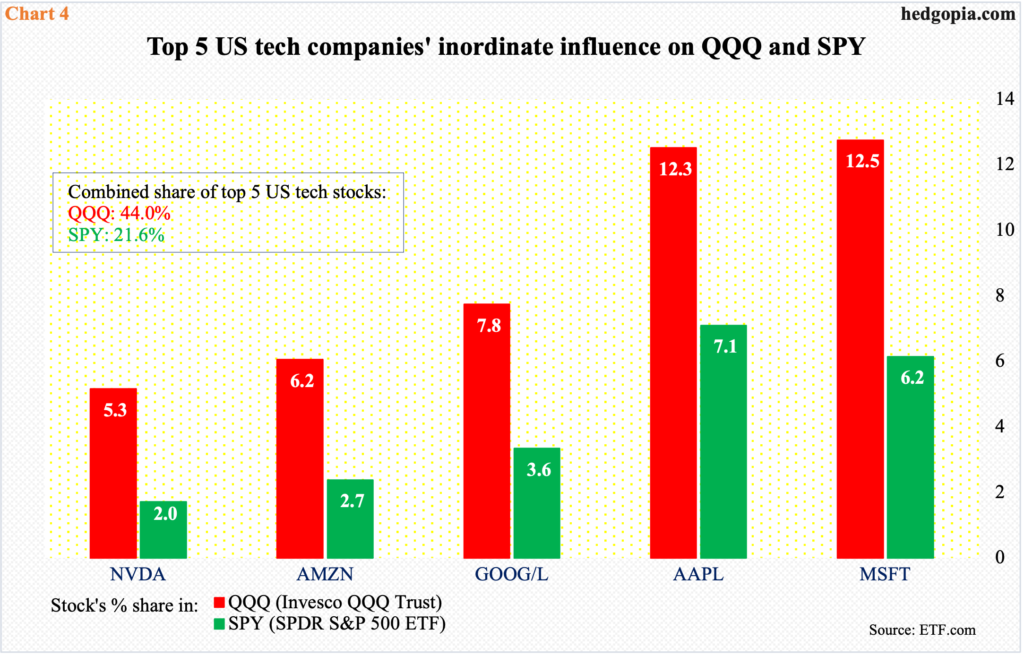
Both the S&P 500 and Nasdaq 100 are market cap-weighted indices. As Chart 4 shows, the top five – Microsoft (MSFT), Apple (AAPL), Alphabet (GOOG/L), Amazon (AMZN) and Nvidia (NVDA) – have a combined share of 44 percent of QQQ (Invesco QQQ Trust). These are all tech companies and account for 21.6 percent of SPY (SPDR S&P 500 ETF).
In other words, as tech goes – or, as these tech behemoths go – so goes the S&P 500.
Ironically, the impending deceleration in the economy in all probability is yet to get reflected in analyst estimates. This holds true for all caps – large, mid, and small.
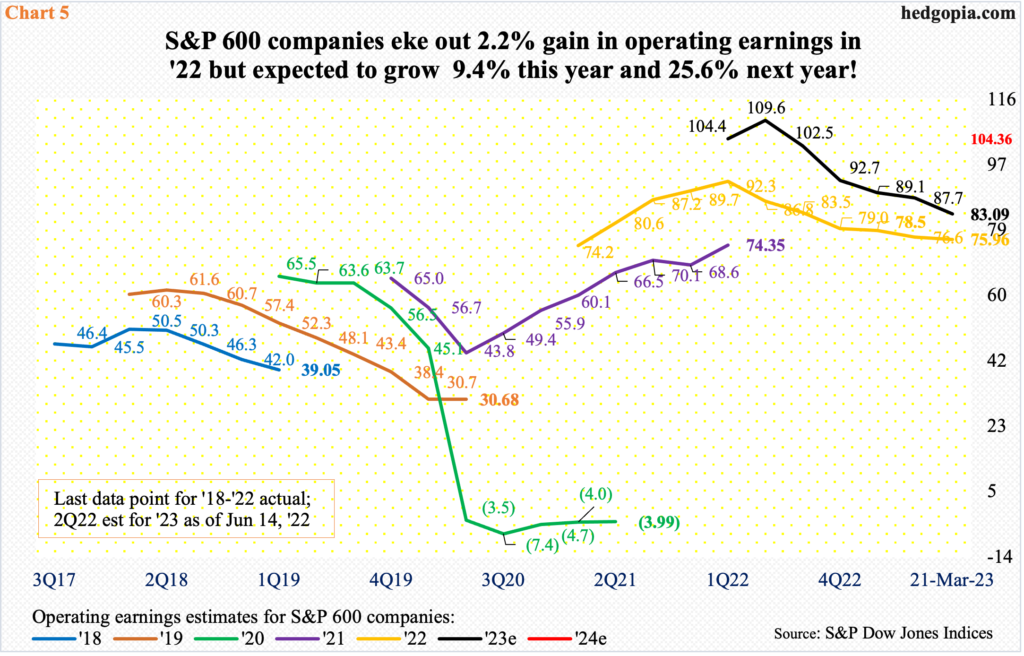
Staying with the small-caps for our purposes here, S&P 600 companies in 2020 lost $3.99 a share in operations, as the economy was hit with a brief two-month recession in March and April. In 2021, these companies earned $74.35, followed by $75.96 last year, for growth of 2.2 percent.
For this year, the sell-side expects growth to accelerate to 9.4 percent to $83.09. If this is not already pie-in-the-sky, earnings are forecasted to grow another 25.6 percent next year to $104.36.
If past is prelude, these analysts have a habit of starting out optimistic and then bring out the knife as the year progresses. For 2022, they had penciled in $92.70 last April. Even for 2023, they were expecting $111.23 last June, before downward revision hit (Chart 5).
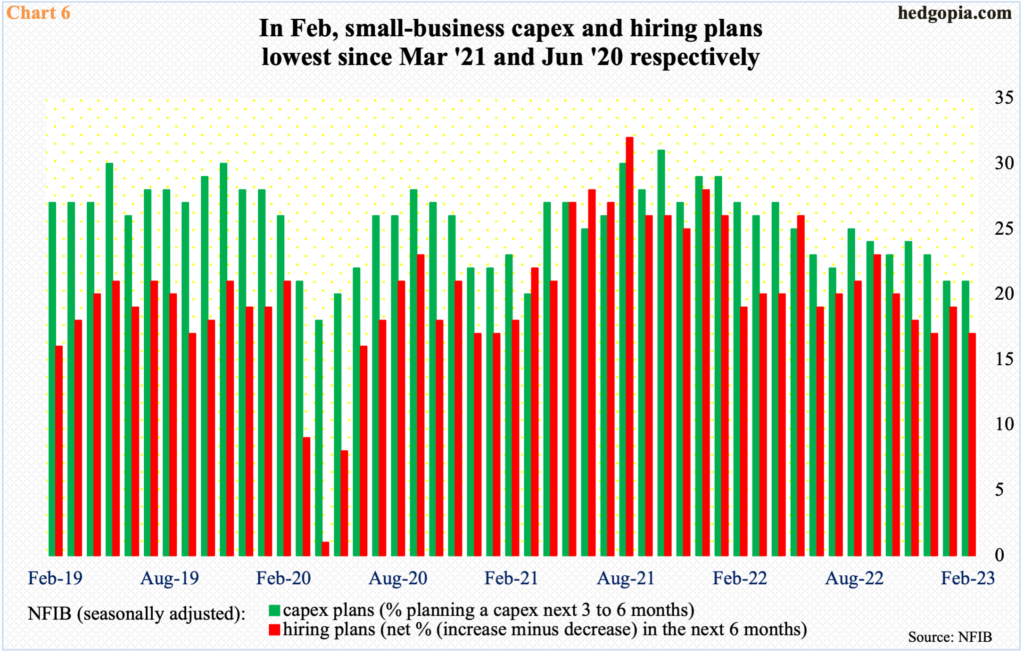
Sell-side earnings optimism does not also jibe with the wink and the nod of small-cap board rooms. Members of the National Federation of Independent Business, which represents small businesses in the US, are not very optimistic about business prospects going forward. If they were, they would be investing in capital projects as well as human capital. They are not.
In February, NFIB capex and hiring plans stood at 21 and 17 respectively, unchanged and down two points month-over-month; these readings were the lowest since March 2021 and June 2020, in that order (Chart 6). Reading these tea leaves, small-cap managements are hardly exuding confidence. In their eyes, the future is at least uncertain – if not outright gloomy. The Russell 2000 is reflecting this; the sell-side is yet to jump on this bandwagon.
Thanks for reading!
