
- Oil-and-extraction jobs are just beginning to come under pressure
- More on the way as mining-and-logging job openings crater
- In Jan and Feb, energy job-cut announcements >36k
Since crude oil peaked in the middle of last year, investor attention has been focused on how this would all end up impacting U.S. oil jobs. By December, the West Texas Intermediate crude was down more than 50 percent, yet oil-and-extraction jobs were holding up just fine. Even though they peaked in October at 201.5k, it was only in January that they began to come under pressure in earnest. Since that peak, these jobs have been reduced by 3.2k. Support-activity jobs are following the same trajectory – peaked at 337.6k in September and since has been reduced by 4.1k. In Chart 1, the blue and red lines are beginning to show the first noticeable hook down.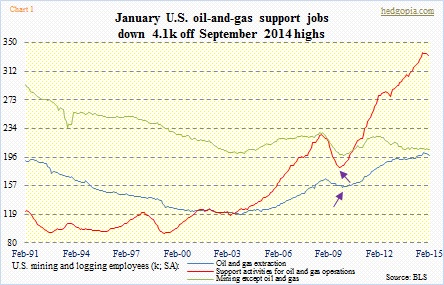
Nonetheless, in the big scheme of things these reductions are relatively small in relation to the pace of job creation the oil industry has seen the past five years (violet arrows in Chart 1).
So more job cuts on the way then? Sure looks that way.
Chart 2 compares job openings in non-farm with those in mining and logging. (Please keep in mind that mining and logging is a broad category, which includes oil, coal, etc., nevertheless helps us get a sense of what is transpiring in oil.) In non-farm, December was revised lower, still the trend decidedly remains up. At five million openings, January was a new high. Mining and logging is going the other way. At least it is beginning to. Look at the collapse in the red line in Chart 2. Job openings peaked at 35k in October, and by January had dropped to 13k. Job openings and payroll growth track each other well.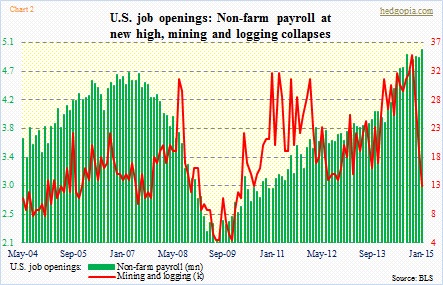
A similar trend is showing up elsewhere.
The past two months, job-cut announcements in the energy sector have seen a sharp spike (Courtesy of Challenger, Gray & Christmas). They were 20.2k in January and 16.3k in February, from the prior 1k-2k range. Hence the surge in the green bars in Chart 3. As a result, the share of energy job cuts in the total has surged to the 30 percent range. Total job cuts were 53k in January and 50.6k in February. Since these cuts are recent, they are probably yet to show up in the monthly jobs number – both energy and non-farm.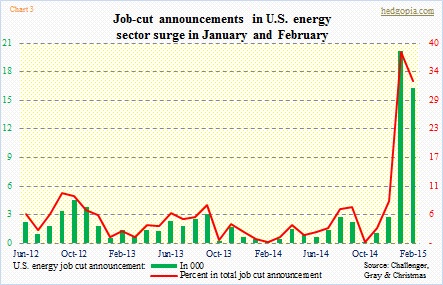
In all probability, the blue and red lines in Chart 1 have a ways to go on the downside. This can reverberate through average private-sector wages in two ways. (1) These are high-paying jobs. In January, oil-and-extraction paid $41.70 an hour (versus $24.78 for private employees). And (2) job cuts will put more oil-and-extraction talent on the market, and that has the potential to put downward pressure on wages. Their average hourly earnings peaked in December at $41.72. As early as July 2013, they were making $33.55/hour.
This is one more headwind for those expecting persistent increase in average hourly earnings of private employees.
