
Both the S&P 500 and Nasdaq 100 saw buyers and sellers pounce on opportunity at important technical levels. Bulls have an opportunity to cash in on bearish sentiment that has sharply risen of late in the options market. For that, they need to first clear the nearest hurdle, which rejected breakout attempts last week.
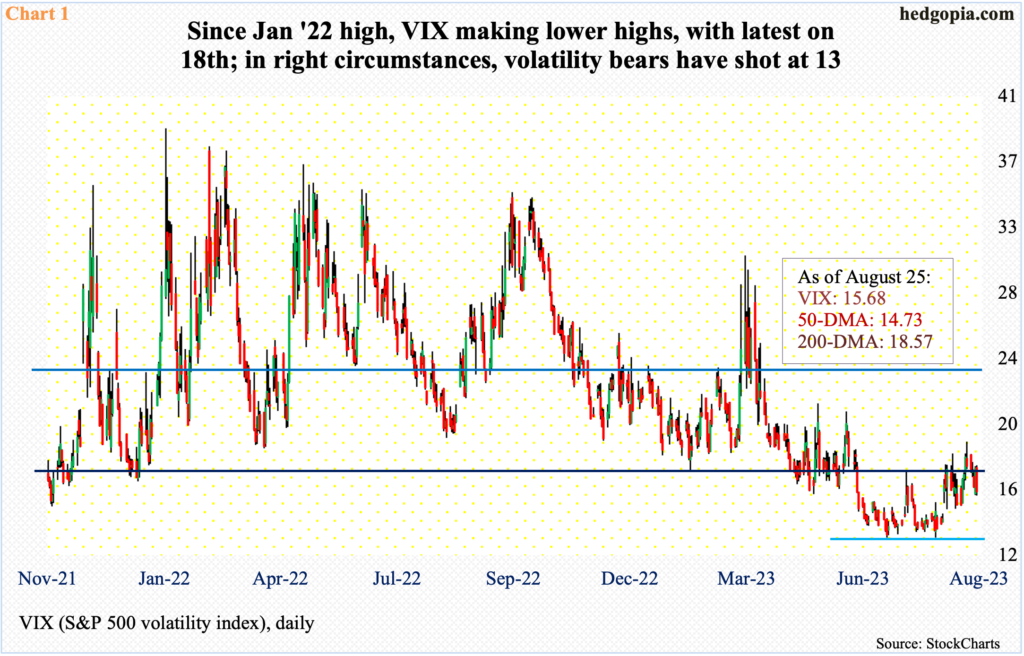
VIX closed last week at an interesting spot.
From its high of 38.94 reached in January last year, the volatility index has persistently made lower highs, with the most recent occurring on the 18th this month. This was six trading sessions ago, and the high of 18.88 was rejected at the 200-day moving average. A day prior, the daily RSI stopped going up just north of 66, with the metric ending last Friday at 49.45. A decisive breach of the median means the momentum indicator heads back into the sub-50 territory where it lied for months before breaking out early this month.
A loss of momentum obviously is not good news for volatility bulls – timing and magnitude notwithstanding. Mid-to long-term, VIX’s monthly is just beginning to move up and has a long way to go on the upside. In the near term, however, volatility bears in the right circumstances have a shot at 13 – or just underneath – which VIX fell to in both June and July (Chart 1).
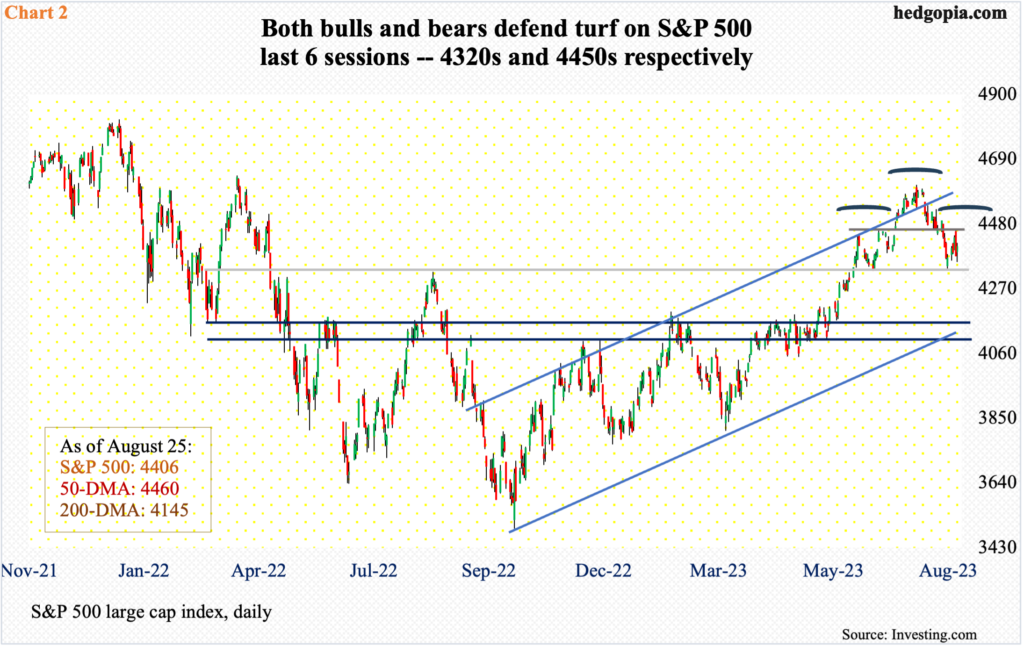
In this scenario, the S&P 500 can have another go at 4450s. The large cap index finished last week at 4406.
The index began last week with an up Monday. This followed an intraday drop to 4335 in the Friday before that, during which bids were strong enough to end the session at 4370. A year ago, the S&P 500 retreated sharply lower from 4320s, subsequently bottoming in October. On June 12, this level was reclaimed, followed by a successful breakout retest on the 26th that month.
The S&P 500 then rallied for a whole month, touching 4607 on July 27 – up 31.9 percent from last October’s low – before reversing in a bearish engulfing session. Last Thursday, when the index reversed from up 0.5 percent intraday to down 1.3 percent by close, a similar candle formed, as selling was intense at 4450s horizontal resistance, which coincided with the 50-day at 4460.
So, in essence, both bulls and bears successfully defended their respective turf the last six sessions – 4320s and 4450s, in that order (Chart 2).
There is room to rally on the daily. But for positive momentum to begin, 4450s need to convincingly give way. This is where VIX comes in; a breach of the median by the daily RSI should lend a helping hand to equity bulls.
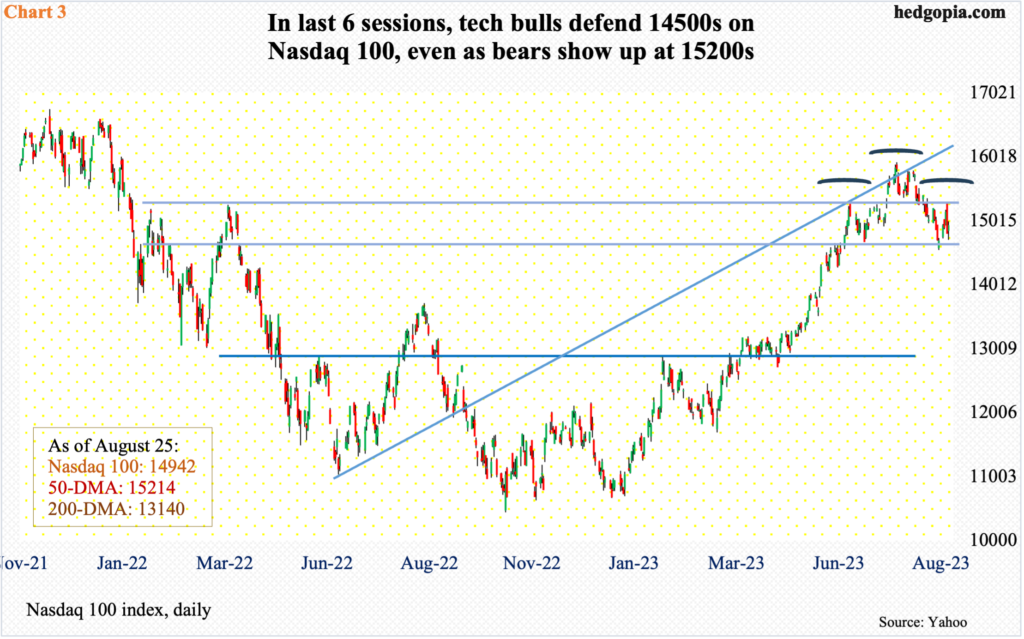
Things are no different in the tech land. As was the case with the S&P 500, Nasdaq 100 bulls and bears showed up last week where they were expected to.
Six trading sessions ago on the 18th, after dropping 8.6 percent from the July 19th high (15932), tech bulls defended lateral support at 14500s. By Thursday, they had rallied the Nasdaq 100 to 15279, before a wave of sell orders overwhelmed them; when it was all said and done, the session reversed from up 0.9 percent at one time to down 2.2 percent by close, forming a huge bearish engulfing candle. Tech bears defended both horizontal resistance at 15200s as well as the 50-day at 15214.
Inability to rally here raises the odds the index ends up completing a head-and-shoulders pattern, which will be a bearish development (Chart 3). There is a similar pattern on the S&P 500. Hence the significance of where these indices are trading currently.
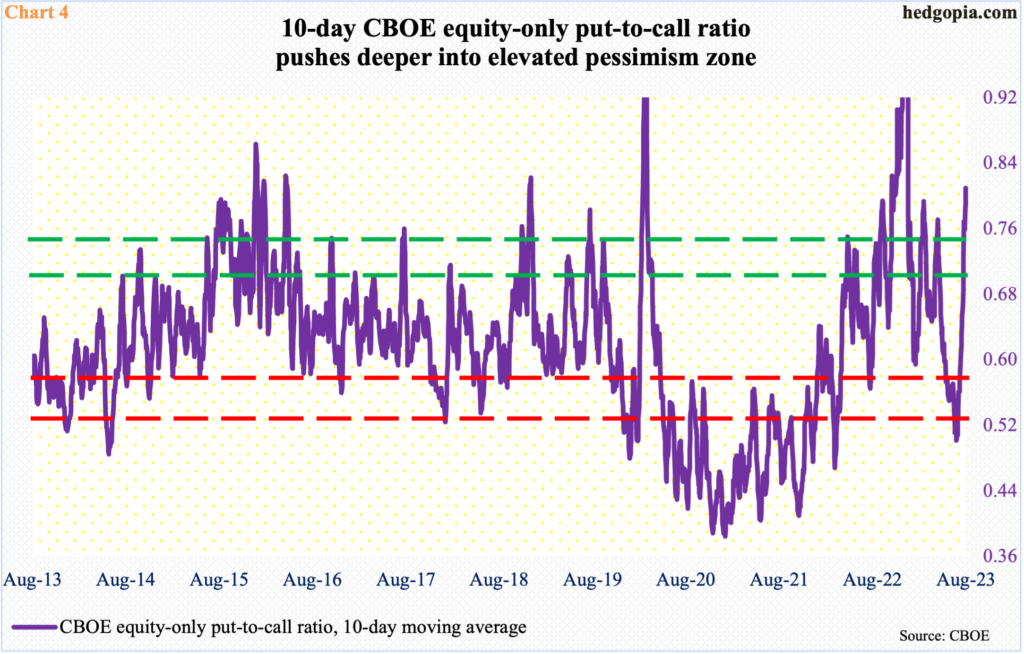
Equity bears are increasingly convinced that momentum is shifting their way. This is evident in the way puts and calls are being traded.
On the 16th (this month), for the first time since March 10 (this year), more puts traded on the CBOE than calls, with the equity-only put-to-call ratio registering 1.03. For four sessions prior to that, the ratio produced readings of 0.70s. Traders’ fascination with puts continued, as the ratio was nearly unity on the 17th, coming in at 0.97. In the next six sessions, there was one reading in the mid-0.50s, the rest were all elevated, with last Friday recording another 0.97 reading. As a result, the 10-day average finished last week at 0.81 – the highest since January this year.
As a matter of fact, on December 30 last year, the 10-day average of the ratio rose as high as 1.21, remaining north of one for 10 consecutive sessions. From late-December lows, the S&P 500 rallied 400 points before turning lower early February at 4195.
The current level of pessimism is nowhere near as elevated as was the case late last year or early this year. With that said, if history is any guide, sentiment is very pessimistic (Chart 4). This creates an opportunity for equity bulls. If they succeed in decisively taking out 4450s, this can act as a self-fulfilling prophecy, as the put buyers who are betting on this resistance holding begin to unwind their positions.
Thanks for reading!
