
Investors Intelligence bulls crossed 60% this week. It is rare for sentiment to persist at 60 percent or higher. Yet, equity bulls at this juncture are probably wishing that happens. They need to be able to first defend the 50-day on the S&P 500. A test likely is around the corner.
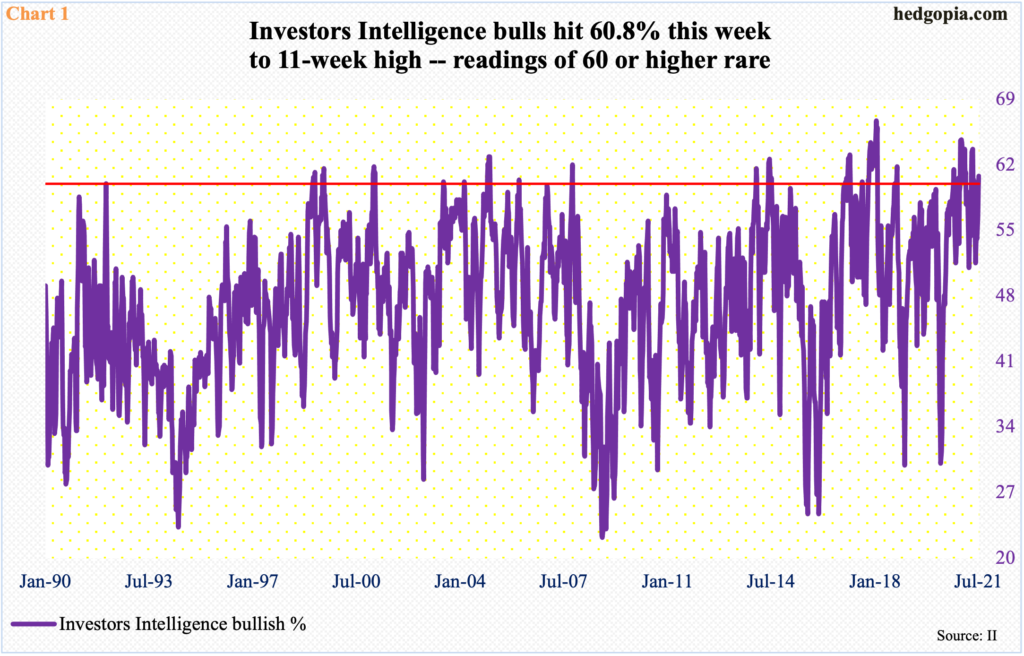
Leading up to the start of 2Q earnings, investor sentiment got perky. Leading US banks and brokers start reporting next week (more on this here). This week, as of Tuesday, Investors Intelligence bulls hit 60.8 percent, up 1.2 percentage points week-over-week. This was an 11-week high.
Readings above 60 percent are rare (Chart 1). Going back to January 1990, which amounts to 1,644 weeks, the bullish percent has hit 60 percent or higher 76 times. That is it.
Most recently, sentiment trended higher after bottoming at 51.5 percent in the week to May 25.
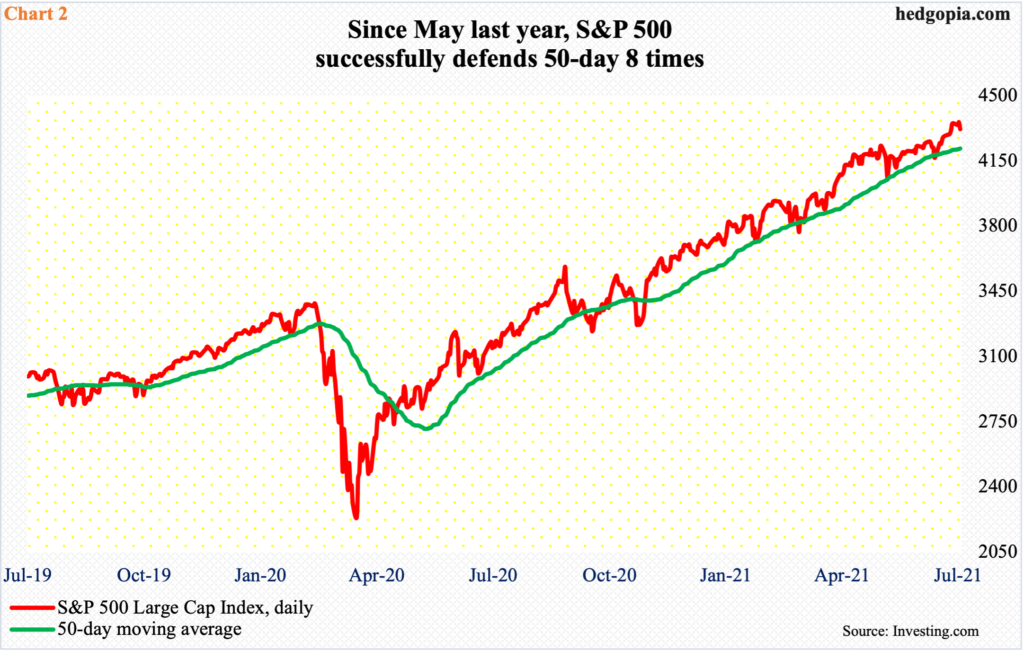
That was shortly after the S&P 500 bottomed just under the 50-day after a brief selloff. Since May last year, coming on the heels of a major bottom in March that year, the average has been tested eight times (Chart 2). May’s was the seventh, with the eighth during June 18-21. There have been a few breaches along the way but did not last very long. The latest breach took place on June 18, which was a Friday, but the average got reclaimed as soon as the following week began. Three sessions later, on the 24th, the S&P 500 broke out of 4250s.
This week, intraday weakness on both Tuesday and Wednesday was bought, resulting in potentially bearish hanging man candles in both sessions. Thursday, the index fell 0.9 percent but was down as much as 1.6 percent at the lows, forming a dragonfly doji. Dips are being bought but at the same time these candles show that some are getting nervous. Prior to this, the daily was way extended, with the RSI just having entered the 70 zone.
The way things are shaping up, a test of the 50-day looks likely in the sessions ahead. It remains to be seen if bulls will once again be able to save the average. Sentiment is elevated but if past is prelude it can remain elevated for a while.
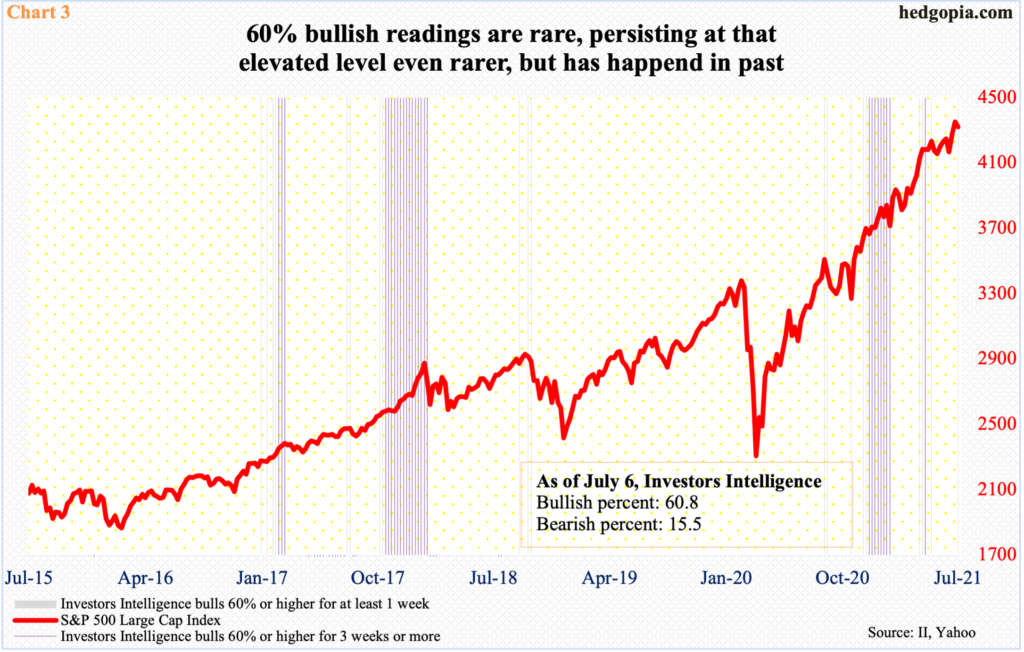
Chart 3 plots (1) bulls 60 percent or higher for at least one week, and (2) bulls 60 percent or higher for three weeks or more. No. 1 obviously is more prevalent, but in the past five years there have two occasions in which No. 2 seriously unfolded. Between October 2017 and January 2018 and then between December 2020 and January 2021, bulls’ count of ‘60 percent or higher for three weeks or more’ lasted 15 and eight weeks respectively. Both times, the S&P 500 persisted higher.
This is what the bulls are hoping for. Hence the significance of the 50-day at this juncture. A lot of people tend to make investing decisions just based on this average and the 200-day. Thursday’s early weakness was a bit unnerving in this regard. It is equally possible sentiment – elevated as it is – gets adversely impacted by this. Next week’s reading will drop some clues as to if the 50-day will continue to attract bids.
Thanks for reading!
