
U.S. stocks began 2016 on the wrong foot. That is an understatement.
In fact, major indices peaked intra-day on December 29th (2015). Using that high, the S&P 500 large cap index through the intra-day low on January 20th lost 13 percent. For 2016, through that low, it was down 11-plus percent.
Off the February 11th low, the S&P 500 has recovered half of the 2016 loss – down six-plus percent for the year.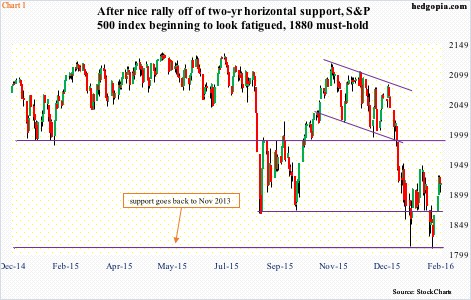
The bigger question is, is the worst over?
Bulls can point to recent constructive developments. They were able to defend 1800… this horizontal support goes back two-plus years.
Plus, the January 20th low, followed by a February 11th retest, looks similar to what transpired in August-September last year. Back then, the first low was made on August 24th, followed by a successful retest on September 29th (Chart 1). The S&P 500 then went on to rally 13-plus percent in the next five weeks.
Off the February 11th intra-day low through the high last Wednesday, the S&P 500 tacked on 6.7 percent… in less than four sessions. On both occasions, lows were marked by weekly hammers. Naturally then, both bulls and bears are wondering, is this a precursor to a rally that unfolded off August-September lows?
The short answer is, it is possible, but not probable.
The sell-off in August-September last year and in January this year did not come out of nowhere. It had been some time in the making. The S&P 500 peaked in May last year, but had essentially been going sideways since February (Chart 1).
Important sectors such as small-caps and transports had been deteriorating even longer.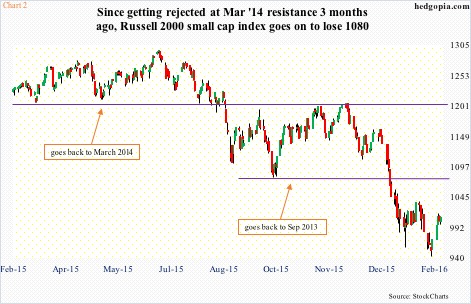
The first time the Russell 2000 small cap index retreated from 1200-plus was in March 2014. It was not until February last year that it managed to break out of it, only to lose it again during the August sell-off. The subsequent rally was repelled by that resistance in September, November and again in December (Chart 2). In the selling that followed, the index also lost 1080.
Similarly, the Dow Jones Transportation Average peaked as early as November 2014, then proceeding to lose 8500 in May 2015 (recall that the S&P 500 peaked in that month). Last December, the average went on to lose support at 7600-7700 (Chart 3).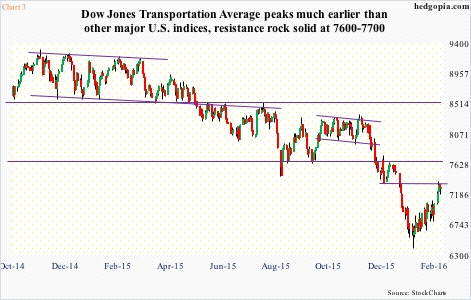
In fairness, transports have been showing nice price action in the past month. If the momentum continues, there is massive resistance at 7600-7700. That said, it is hard to imagine a test of that resistance without the average first unwinding the daily overbought conditions it is in.
If we just focus on investor sentiment, there may be reason to be hopeful. From a contrarian perspective, that is.
In the week ended February 10th, Investors Intelligence’s bullish percent was 24.7 – the same reading as on September 29th. Bears were 39.2 percent, higher than the 35.1 percent on September 29th. In fact, the bull-bear ratio has been below unity the past six weeks (more bears than bulls).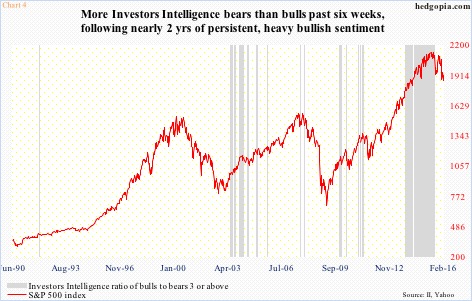
For some perspective, however, Chart 4 helps. The grey bars represent periods when the ratio is above three or higher. Sentiment heavily leaned bullish for nearly two years, and began to weaken once stocks sold off last August. Given sentiment remained excessively bullish for such a long time, it is equally possible it swings the other way and remains there for an extended period. Time will tell.
For now, the only way bulls’ percent begins to rise from these suppressed levels – as unfolded in October-November last year – and for stocks to follow along is if money begins to flow into stocks. News on this front is not that encouraging. So far.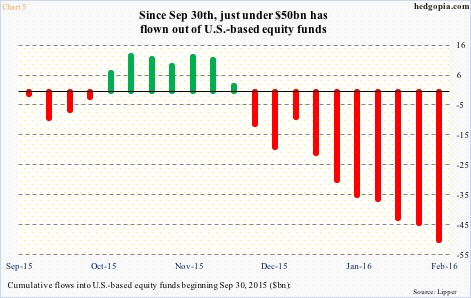
Using late-September lows (in stocks) as a reference point, Chart 5 cumulatively calculates flows into U.S.-based equity funds beginning September 30th. In the 21 weeks, flows have been positive in six, and negative in 15. Cumulatively, nearly $50 billion has left. Just this year alone, $41 billion has said ‘bye, bye’ to stocks.
This is coming on top of foreigners continuing to avoid U.S. equities. Since August last year through December, they have sold $81 billion in U.S. equities. Chart 6 calculates a 12-month rolling total of net foreign purchases, and December saw an exodus of a record $126 billion (data goes back to 1978). By the way, notice the divergence between the green bars and the red line for nearly two years now.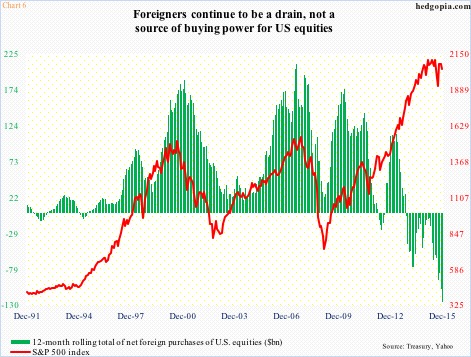
Bulls for sure are hoping that the red line in Chart 6 does not catch up with the green bars. But they would be increasingly doing so in the midst of deterioration in earnings.
As is the case with stocks, deterioration in earnings has been taking place for a while now. Operating earnings of S&P 500 companies peaked at $29.60 in 3Q14. In the five quarters since, earnings have dropped year-over-year in each quarter, with 4Q15 on pace for a 5.3-percent drop to $25.35.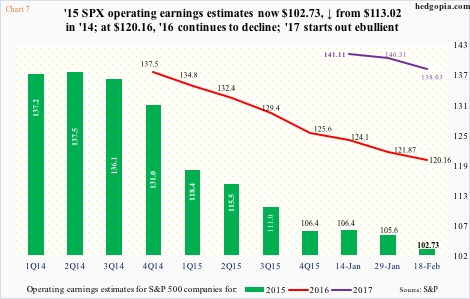
At the end of 2Q14, 2015 estimates were $137.50, which are now expected to come in at $102.73 (no typo); 2014 was $113.02. In February last year, 2016 was expected to come in at $137.50 as well, but so far has been cut to $120.16. Not surprisingly, 2017 starts out at a very optimistic $141.11, and has been cut by $3 in a little over a month (Chart 7); it probably has a long way to go on the downside.
This is probably one reason why non-commercials had been raising net shorts in S&P 500 e-mini futures since the third week of December, having well-timed the December-January sell-off in the index. In the week through last Tuesday, they cut those by 32 percent, helping the S&P 500 rally.
In October-November last year, non-commercials’ rather high net shorts acted as a tailwind for the index as those positions got unwound (Chart 8). In the right circumstances, there is room for a repeat of that.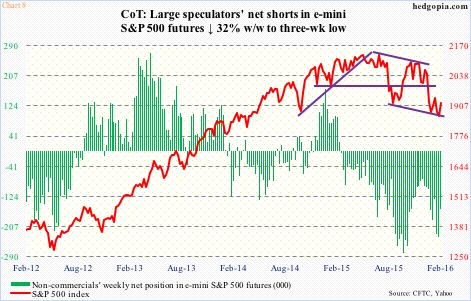
But once again, it comes down to flows, which of late have been nothing but a disappointment (Chart 5). Corporate buybacks have been the other reliable tailwind, and even there it has been more or less going sideways.
Buybacks of S&P 500 companies were $151 billion in 3Q15, second only to cycle-high $159 billion in 1Q14. The four-quarter rolling total was $559 billion in 3Q15, and had been in the $550-billion range since 3Q14 (Chart 9) – not enough when other sources of buying power are drying up.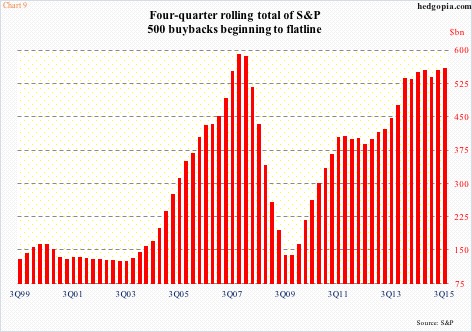
That is the problem the bulls are facing. And that is why the bears will have a field day if major indices manage to rally to resistance – the S&P 500 (1918) to 1990, the Russell 2000 (1010) to 1080, the Dow Jones Transportation Average (7286) to 7600-7700, the Nasdaq 100 (4164) to 4300-4350, and the Dow Jones Industrials (16392) to 16500.
Odds are they begin to come under renewed selling pressure well before that.
Thanks for reading!
