
After three or four down weeks, major US equity indices have reached decent support. Right here and now, odds favor bulls more than bears.
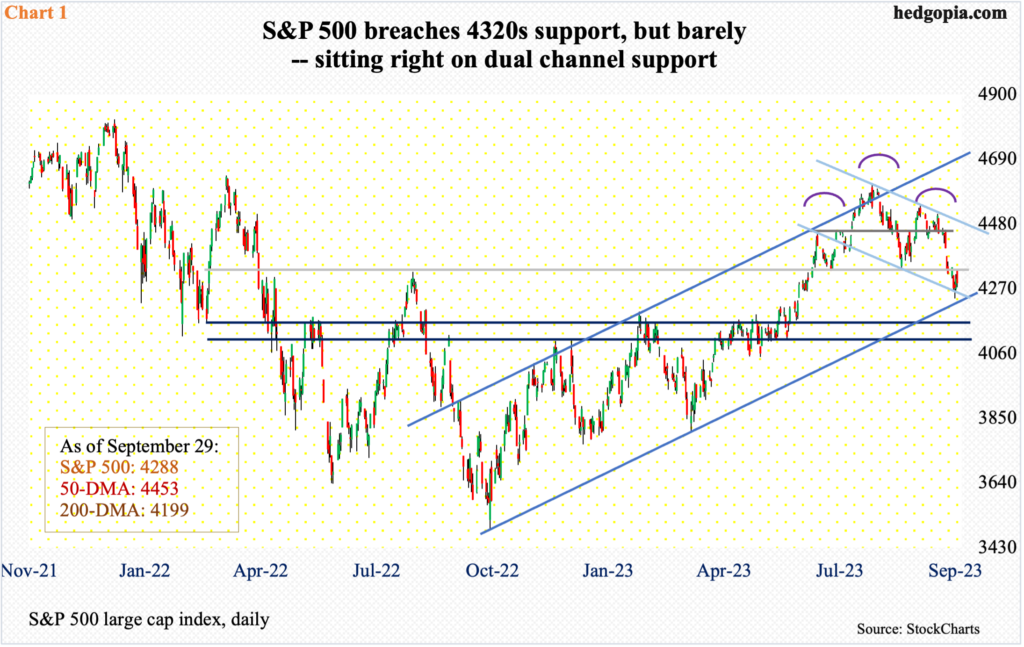
From its July 27th high through last Wednesday’s low, the S&P 500 gave back eight percent. This followed a 34.9-percent jump from last October’s low. Mid- to long-term, the large cap index is not done going down. Near term, though, bulls have an opportunity here.
Last week’s low of 4239 was posted just above the 200-day moving average, which closed Friday at 4199. Bears succeeded in breaching crucial lateral support at 4320s, but they will face difficulty in making further progress right here and now.
Closing last week at 4288, the S&P 500 currently sits at dual channel support – one falling, from the July high, and the other rising, from last October’s low (Chart 1).
Incidentally, the index also finds itself in a bearish head-and-shoulders pattern, the neckline of which lies at 4320s, which for now has been broken, but barely. Bulls’ problems will magnify if this level continues to attract offers, which was indeed the case last Thursday and Friday. For now, longs deserve the benefit of the doubt.
Ahead, after the 4320s hurdle is taken care of, a gap from September 21st gets filled at 4400, with channel resistance at 4450s, which is where the 50-day (4453) lies.
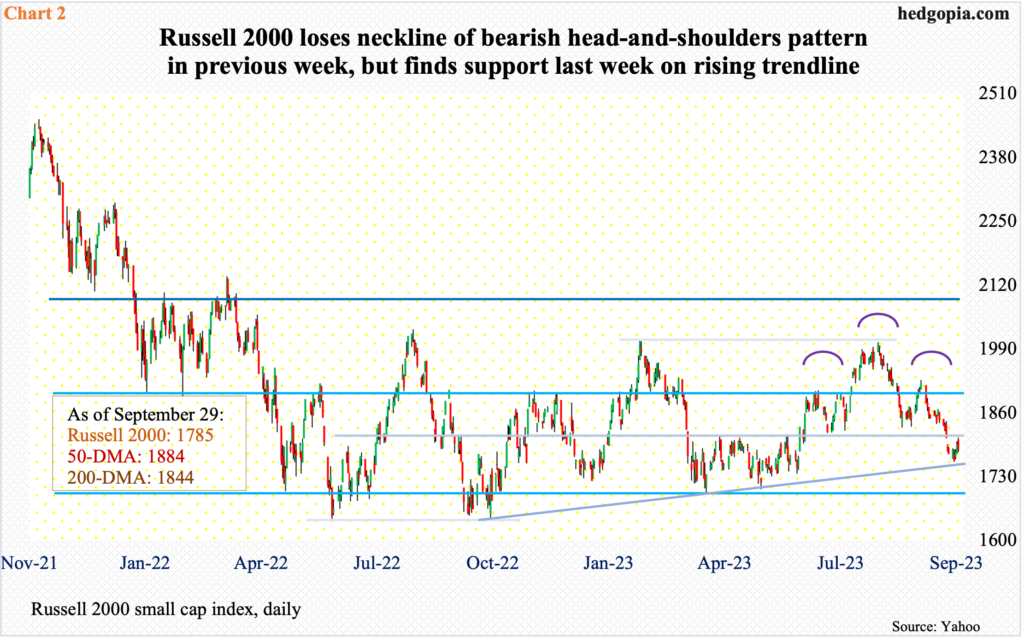
A bearish head-and-shoulders pattern has also formed on the Russell 2000, and the neckline at 1800 was broken in the week before. If the pattern completes, small-cap bears will in due course be targeting 1600. In June and October last year, the selloff that began in November 2021 ended at 1640s (Chart 2). But for this scenario to pan out, 1700 needs to give way and before that 1740s, with the latter representing a rising trend line from last October. In three sessions last week between Monday and Wednesday, bids showed up at 1760s.
At the same time, sellers showed up both Thursday and Friday just north of 1800. The small cap index ended the week at 1785. Once 1800 is reclaimed – with decent odds of that happening – the path toward 1900 opens up.
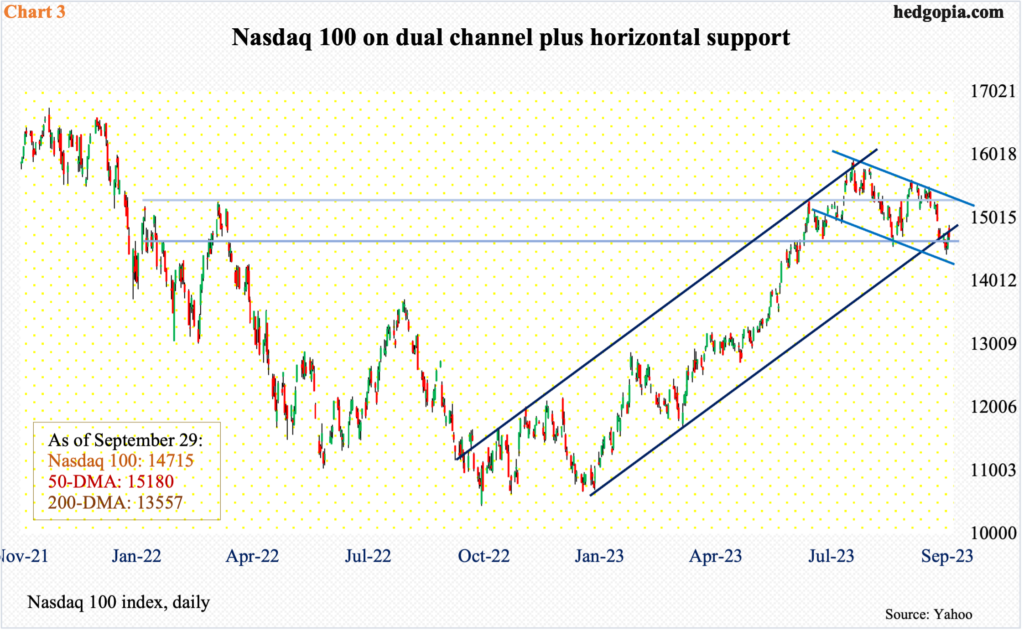
This is also true with the Nasdaq 100, which shed 9.4 percent between its July 19th high and last Wednesday’s low and has approached a zone where there is triple support.
There is horizontal support at 14700s, which is where the tech-heavy index (14715) finished last week. Like the S&P 500, the Nasdaq 100 also finds itself in the middle of dual channel support. There is a descending channel from the July high and an ascending channel from this January (Chart 3).
Trendline resistance from the July high lies at 15300s. Before that, a gap-down from September 21st gets filled at 14960s, with the 50-day at 15180, which just about lines up with horizontal resistance at 15200s.
Last week was a minor up week, up 0.1 percent, but the weekly also produced a spinning top, with a high of 14902 and a low of 14433. Tech bulls are putting their foot down.
Thanks for reading!
