
On an absolute basis, margin debt remains huge, but has not grown much this year. Except for corporate buybacks, margin debt, along with other sources of buying power, have softened.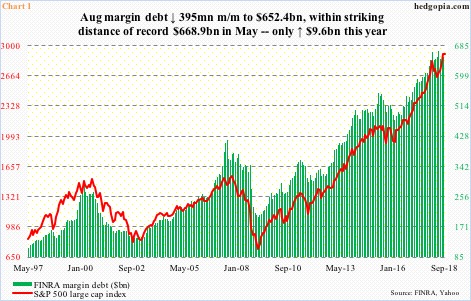
The S&P 500 large cap index jumped three percent in August. FINRA margin debt was not much of a factor in this. In fact, it fell $395 million month-over-month to $652.4 billion. Margin debt has slightly decelerated from record $668.9 billion in May, but it remains massive. As far as equities are concerned, the larger the leverage, the higher the risk once it begins to sustainably contract (Chart 1).
From this perspective, the rather sideways tendency seen over the past few months is arguably healthy. Year-to-August, margin debt only went up $9.6 billion. In 2017, it surged $113.4 billion. This is not good for continuation of the bull market. Margin debt has been a reliable source of buying power. Just since February 2016, when US stocks put in a major bottom, margin debt has gone up by $178.2 billion.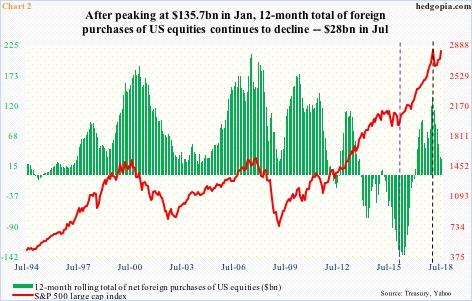
Also back then, foreigners had been heavily selling US equities. In February 2016, on a 12-month rolling total basis, they were selling $145.3 billion worth. That was the worst ever in this metric’s history. The green bars in Chart 2 then began to shrink (violet dashed vertical line). By January this year, net purchases totaled $135.7 billion, before peaking. That was when the S&P 500 (2907.95) retreated after hitting 2872.87. In the 12 months to July, foreign purchases were only $28 billion. Yes, the index has gone on to surpass that high, but not much progress has been made. It is currently within striking distance of the all-time high of 2916.5 which was reached on August 29.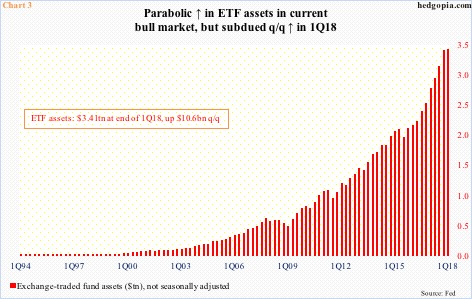
The rather lackluster participation this year by margin debt and foreign purchases has some company elsewhere. Through Wednesday last week, US-based equity funds (including ETF’s) lost $3.1 billion. Contrast this with inflows of $24.3 billion in 2017 (courtesy of Lipper).
Over the years, ETF assets have had a parabolic rise (Chart 3). This has come at the expense of mutual funds. But even here, inflows this year have been subdued. As of 1Q18, ETF assets were $3.4 trillion, up $10.6 billion sequentially. (Data for 2Q will be out later today.) In 2017, assets grew $876.3 billion.
Along the same lines, through Tuesday this week, SPY (SPDR S&P 500 ETF), VOO (Vanguard S&P 500 ETF), IVV (iShares core S&P 500 ETF), QQQ (Invesco QQQ Trust), IWM (iShares Russell 2000 ETF) and IJR (iShares core S&P small-cap ETF) combined took in $9.4 billion this year, compared to inflows of $64.4 billion in all of 2017.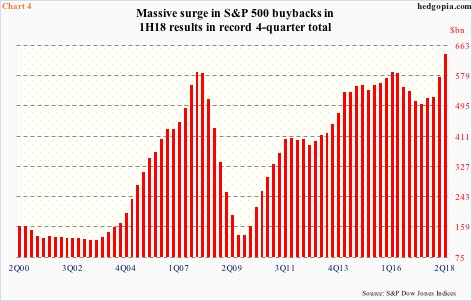
The point is, major sources of buying power have stalled this year. The only saving grace – and a major one at that – has been corporate buybacks.
As of September 1, with 98.2 percent of the buybacks reported, S&P 500 companies spent $185.1 billion in purchasing their own shares in 2Q18. This represents a slight reduction from record $189.1 billion in the prior quarter. The two-quarter total is massive. Chart 4 uses a four-quarter total and on that basis 2Q is on course for a new record.
The question is, is this pace sustainable? The short answer is no. Then the question becomes, when buybacks slow down, what will take its place? If the bull market is to continue, other sources better step up. Thus far, the three other sources are not sending a good signal.
Thanks for reading!
