There was non-confirmation between the spike in VIX a month ago and U.S. high-yield spreads. Depending on which one is sending the right signal will have consequences for whether or not 15-16 support on VIX holds.
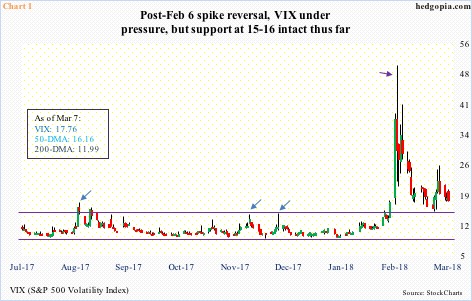
On February 6, spot VIX surged to 50.30 intraday before closing the session at 29.98 (violet arrow in Chart 1). After similar spike reversals, VIX in the past has shown a tendency to continue to unwind (blue arrows). True to this phenomenon, volatility this time around has subsided. Although with a slight twist.
It has been a month since that spike, but VIX – unlike in the past – is yet to enter low double digits, let alone sub-10. Support at 15-16 was tested late February, and held. The 50-day moving average – slightly rising – lied there as well.
At least thus far, this represents a slight change in VIX’s character. Volatility bulls use this to argue VIX has entered a higher plateau. Possibly, except for non-confirmation below.
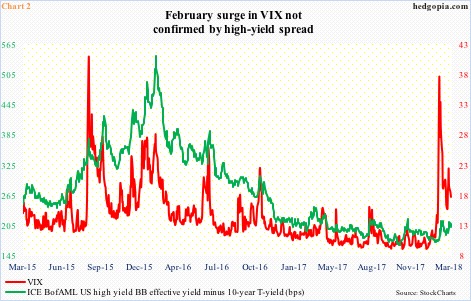
The February spike in VIX was not confirmed by high-yield spreads over Treasury securities.
Chart 2 pits spot VIX with the spread between ICE BofAML US high yield BB effective yield and 10-year Treasury yields. On the 9th (last month), the green line rose to 214 basis points, and again on the 13th, and that was it. Tuesday, it stood at 203 bps. (The chart uses a closing price for VIX, hence does not reflect intraday highs/lows.)
Back in August 2015 when VIX had a similar intraday spurt (high of 53.29), the spread was much higher, and even higher in February 2016 when stocks reached a major bottom. Not this time. High-yield bonds hardly panicked, only spot VIX did. If – big IF – the signal coming from these bonds is right, then this will have repercussions for volatility going forward – at least near term.
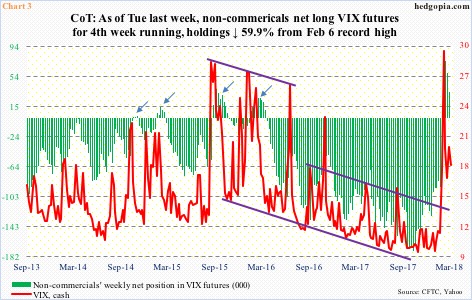
Once again, if volatility has entered a higher plateau, then the afore-mentioned 15-16 support should hold. If on the other hand high-yield bonds are right, then it probably gives way. In the latter scenario, there is plenty of unwinding still left in how non-commercials are positioned in VIX futures.
In the week ended February 6, these traders held record 85,818 net longs. By Tuesday last week, their holdings had dropped to 34,383 contracts, but are still massive historically. In the past, once unwinding begins, non-commercials eventually switch to net short, dragging the cash lower (arrows in Chart 3).
Is it different this time? That will depend on which of the two in Chart 2 is sending the right signal. The line in the sand is 15-16 on spot VIX.
Thanks for reading!

