
US reliance on debt is growing. Having already just about used up the conventional monetary tool and a massive balance sheet, the Fed is looking for new tools – a la Japan. Stocks’ reaction function to Japanification is key.
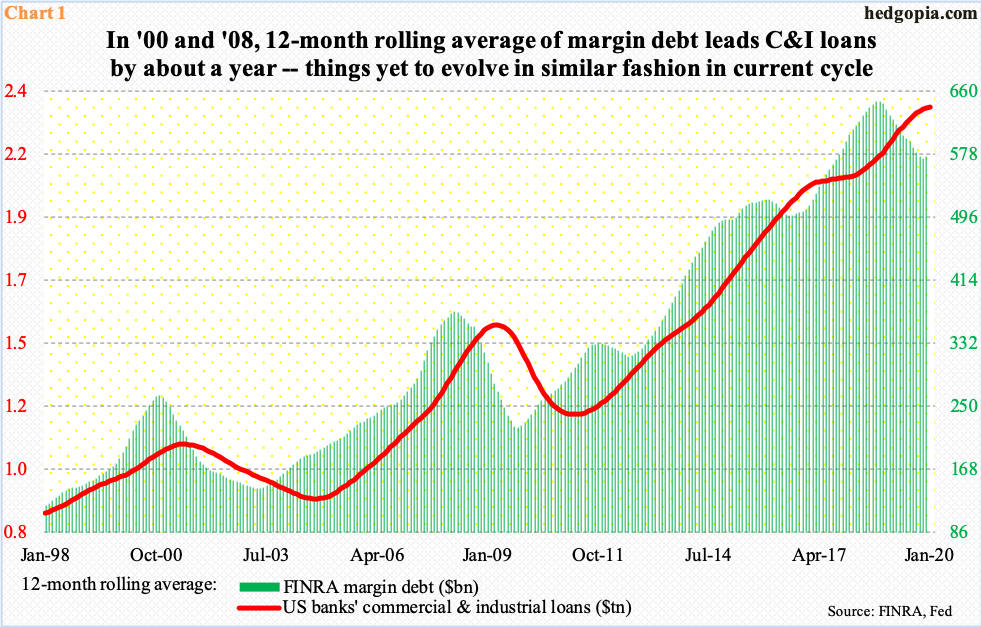
At least going by the prior two business cycles, margin debt tends to lead US banks’ commercial & industrial loans. The 12-month rolling average of FINRA margin debt peaked at $263.7 billion in November 2000, followed by a peak in C&I loans of $1.08 trillion in June of the following year. Similarly, in the next cycle, margin debt peaked at $372.9 billion in March 2008, while C&I loans retreated after posting $1.53 trillion in April 2009 (Chart 1).
This time around, the two have diverged. Margin debt peaked as far back as $646.3 billion in September 2018 (on an absolute basis, its record high was set in May that year at $668.9 billion), with last December at $574.8 billion. C&I loans, on the other hand, rose to a new high $2.35 trillion last month. The red line in Chart 1 looks flattish, which could very well be in the process of turning lower, but it is early to conclude that. Unless the green bars swing back up, it will be interesting how long this divergence lasts.
Arguably, the divergence in Chart 1 is caused by margin debt, not by C&I loans. That is because historically margin debt goes hand in hand with the S&P 500 large cap index. The latter is merely 1.6 percent from its record high of 3393.52 from last Wednesday, while margin debt, at $579.2 billion last December, is $89.7 billion less than its May 2018 high (chart here).
At the same time, debt accumulation in other corners of the economy continue as usual.
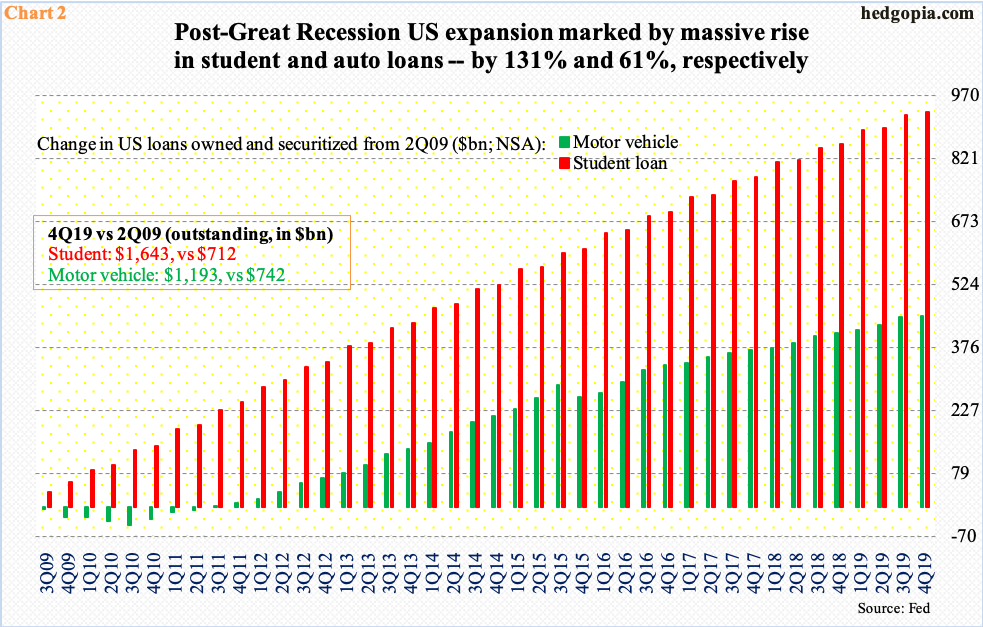
At 4Q19, non-revolving credit stood at $3.1 trillion and revolving at $1.1 trillion – both new highs. The latter is essentially credit cards, while the former is primarily made up of student and auto loans. Chart 2 plots the buildup in student and auto loans in the current cycle.
Great Recession ended in June 2009. Student and auto loans back then stood at $712 billion and $742 billion, in that order. At 4Q19, they were respectively $1.64 trillion and $1.19 trillion, up 131 percent and 61 percent. Granted the pace is unsustainable, the energizer bunny marches on, contributing to growth in the economy.
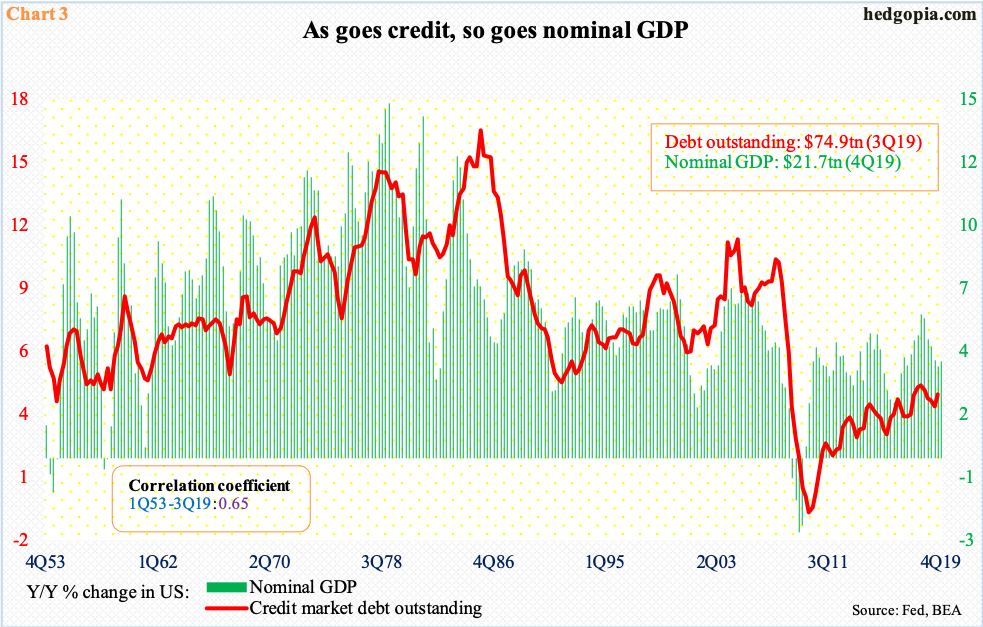
The role of debt in the economy can be seen in Chart 3.
There is tight correlation between the growth rates of credit market debt outstanding and nominal GDP. The ratio between the two was 3.48 in 3Q19. Until 4Q02, it was sub-three, and sub-one until 3Q85.
If there is any solace, the 3Q19 ratio is lower than when Great Recession ended in 2Q09 with a ratio of 3.83. But this is just one metric. Other similar yardsticks are in record territory. The debt (federal)-to-GDP (nominal)-ratio, for instance, was at record 1.05 percent in 4Q19. In other words, it is taking more and more debt to produce the same amount of output.
For the prevailing debt binge to continue, lower rates are the need of the hour. And we have that.
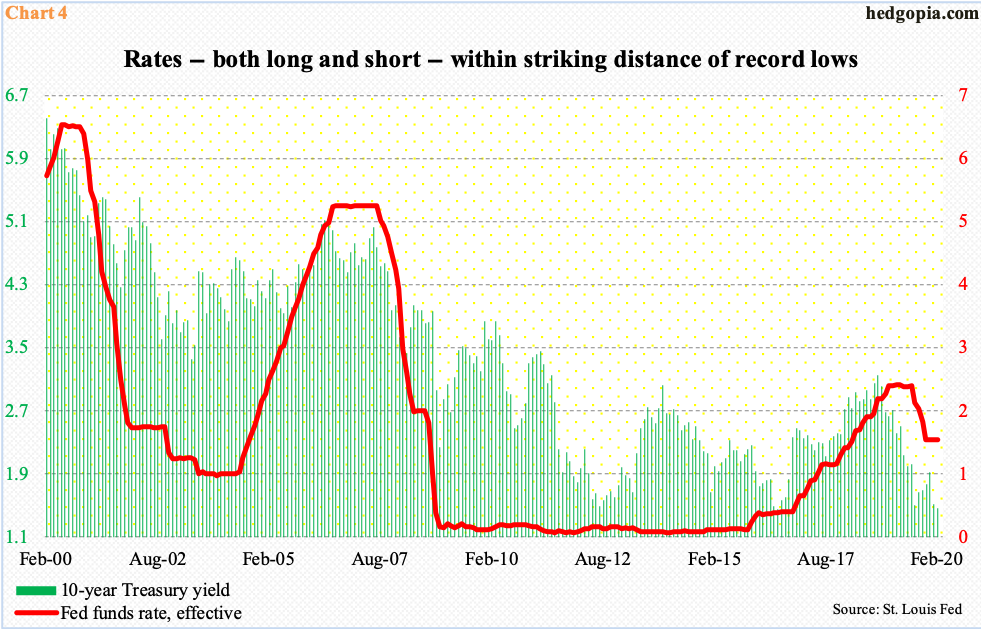
For seven long years through December 2015, the Fed left its policy rate just above zero (Chart 4). After that, the fed funds rate was raised to a range of 225 to 250 basis points before getting cut by 75 basis points last year. Reading the tea leaves, the next move probably will be on the downside, not up. The economy is four months short of completing 11 years of recovery/expansion, and data at best are coming in mixed. Nowhere is this better reflected than in the bond market.
In July 2012, the 10-year Treasury yield dropped to 1.39 percent and then again to 1.34 percent four years after that. At 1.51 percent, rates currently are not that far from those lows. In all probability, new lows are just a matter of time not if. The long end of the bond curve is not as sanguine as equities when it comes to the future outlook of the economy, but the fact remains that this in and of itself helps debt holders through lower interest rates.
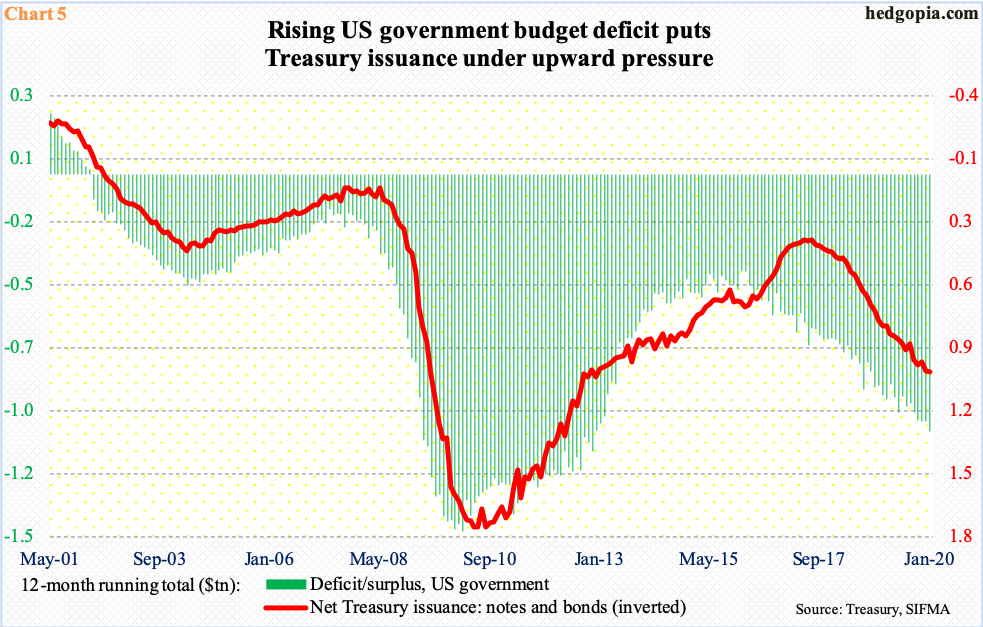
Low rates help the Treasury, among others, to sell debt at a cheaper rate. US budget deficit is running north of $1 trillion. The 12-month total in January was $1.06 trillion – fourth consecutive month of $1-trillion-plus. This needs to be funded.
On a 12-month basis, issuance of Treasury notes and bonds totaled $967 billion in January. In July 2017, this stood at $335 billion. Similarly, in January 2016, US budget deficit was $403.6 billion. The surge in the red ink is coming at a time of growth. We can just imagine how it will fare when the economy contracts. Lower rates will help.
Amidst all this came Fed Governor Lael Brainard’s call last week for the central bank to temporarily set inflation targets above its current goal of two percent. Since Great Recession ended, annual core PCE – the Fed’s favorite measure of consumer inflation – has risen above two percent only 11 months. She also said the Fed should be capping interest rates on Treasury securities in the short and medium term. Translation: yield curve control, under which the Fed would target a long-term rate – let us say, the 10-year – and buy these notes should the yield rise above the target. In 2016, the Bank of Japan began pegging its 10-year rate around zero percent.
The BoJ also deployed quantitative easing as far back as 2001. Benchmark rates are in negative territory. Devoid of tools, it is having to come up with new tools, including purchase of corporate bonds and equity ETFs. Inflation is still a no-show, and economic growth is sluggish. The Fed is going down that path. Its conventional monetary quiver lacks sufficient arrows, and the balance sheet is already bloated. New tools are needed. Ms. Brainard’s speech last week is an attempt to prepare the financial markets for that eventuality. Hence the need to watch markets’ reaction.
Stocks have had tremendous rally, with major indices such as the S&P 500 and the Nasdaq Composite near record highs. But small-caps, which investors in normal circumstances gravitate toward in a risk-on environment, continue to lag.
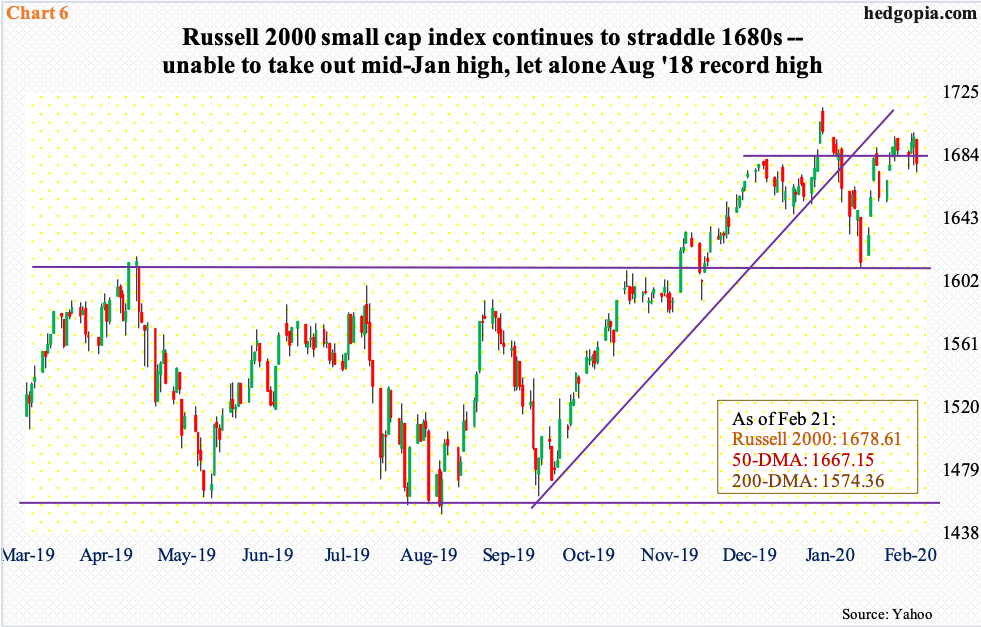
The Russell 2000 small cap index (1678.61) set its record high of 1742.09 in August 2018. Most recently, it peaked at 1715.08 on the 17th last month. Currently, bulls and bears are fighting for control of 1680s, with a likely bias to the downside. In November last year, the index broke out of crucial resistance just north of 1600, which was successfully retested three weeks ago (Chart 6). A sustained loss of this level potentially is markets’ way of saying they have less and less confidence in Japanification of US monetary policy.
Thanks for reading!
