
The Fed’s monthly purchases of bonds has been housing friendly. Reading the tea leaves from this week’s FOMC Meeting, the central bank could begin to reduce the pace of buying toward the end of this year. Sales of new homes have moderated, with a rise in inventory. Action in ITB suggests the ETF has reached an important peak.
The Federal Reserve’s monetary policy has done wonders to housing. After Covid-19 literally brought the US economy to its knees, the central bank began to aggressively expand its balance sheet, which went from $4.2 trillion in early March last year to $8.2 trillion as of last Wednesday.
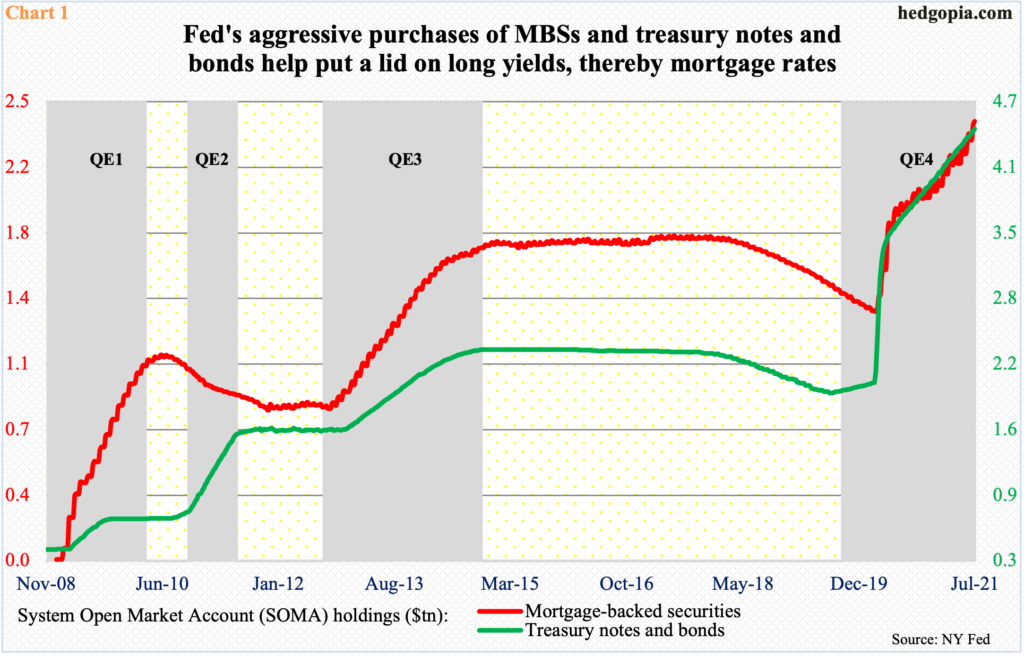
Every month, the Fed buys up to $80 billion in treasury securities and $40 billion in mortgage-backed securities. It currently holds $4.5 trillion in treasury notes and bonds and $2.4 trillion in MBSs, up from $2 trillion and $1.4 trillion in early March last year (Chart 1).
This has helped put a lid on the long end of the yield curve. The 10-year treasury yield (1.26 percent) has not touched two percent since July 2019. The 30-year fixed mortgage rate is below three percent and was down to 2.7 percent last December.
On Wednesday, the FOMC concluded its two-day meeting, leaving the fed funds rate – predictably – unchanged. At the same time, it said it has made some progress towards the economic goals it hopes to achieve before slowing down its bond buying. Previously, it had said it wanted to see substantial progress.
Of its dual mandate – maximum employment and price stability – the Fed is currently focused on the former, overlooking the sharp rise in inflation in recent months. From April last year, the economy has created 15.6 million non-farm jobs to 145.8 million, but this still falls 6.8 million short of the pre-pandemic high from February last year.
With this week’s slight tweak in the language, it is probable the Fed is getting ready to reduce the pace of purchases toward the end of this year.
If this ends up pushing up interest rates, it will obviously act as a headwind for housing. It is one variable, but an important one at that.
Sales of new homes have already moderated from a torrid pace of late last year and early this year. This is also true with US household formation.
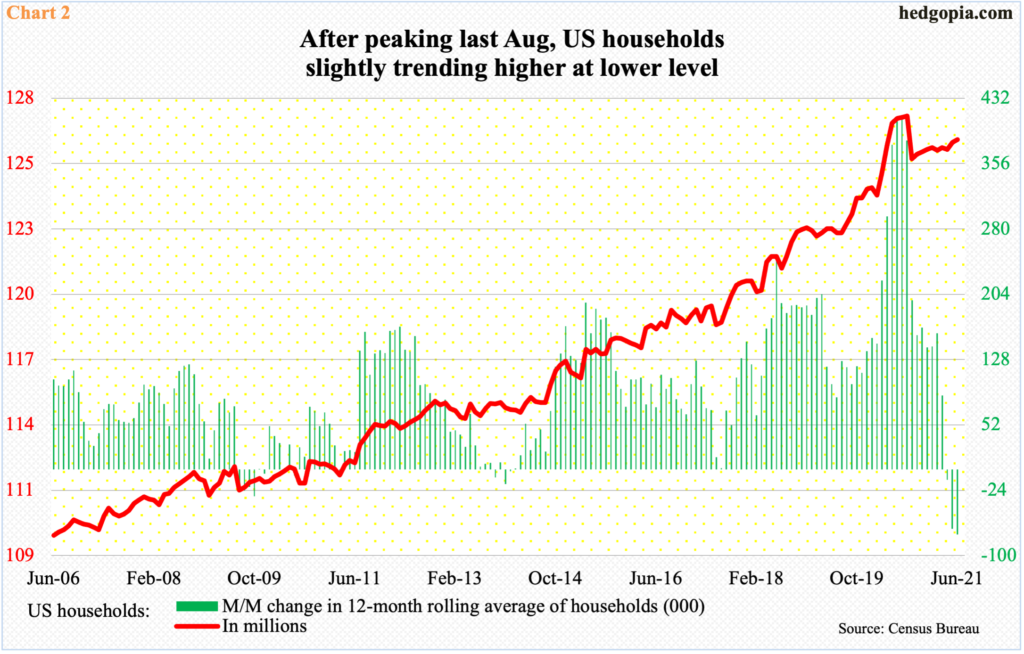
Households peaked at 127.3 million last August, up from 122.7 million a year before that. Chart 2 calculates month-over-month change in 12-month rolling average of households. Based on that, a year ago, that is July last year, the monthly change reached as high as 412,000 before decelerating, with last month down 76,000 to end at 126.3 million.
Last month, sales of new homes were down 6.6 percent m/m to a seasonally adjusted annual rate of 676,000 units. This represents massive deceleration from January’s pace of 993,000; in six of seven months through that month, sales were north of 900,000.
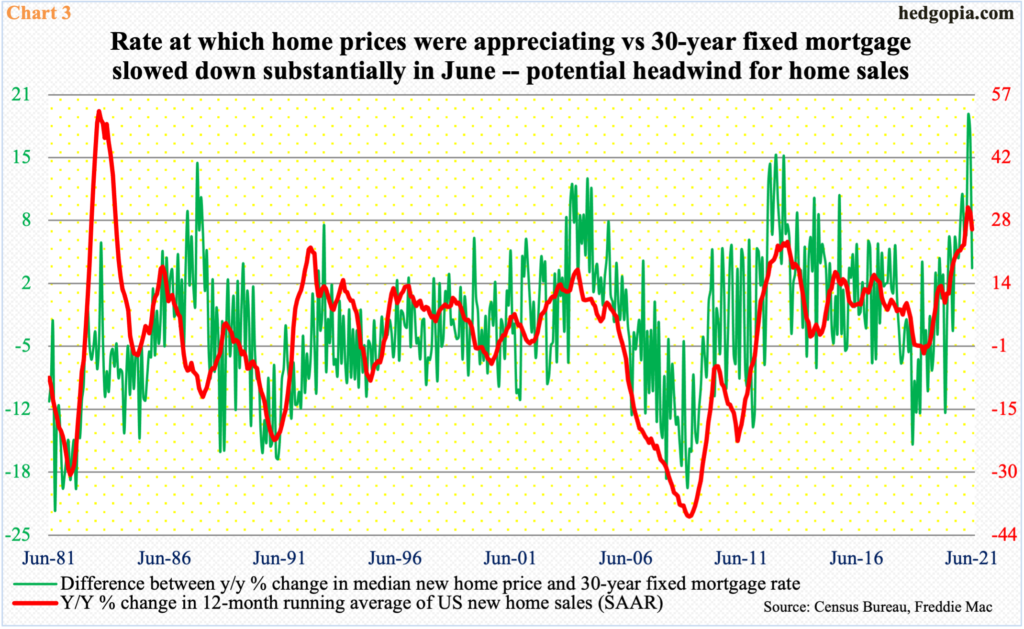
Inventory is low. On top of that, home prices are at record high. The median price of a new home reached $380,700 in May, with June dropping slightly to $361,800. In April, prices were up 22 percent year-over-year; with the 30-year fixed mortgage averaging 3.1 percent in that month, flippers were having a field day. In June, the incentive narrowed to 3.1 percent (Chart 3). Continuation of this is a potential headwind for sales.
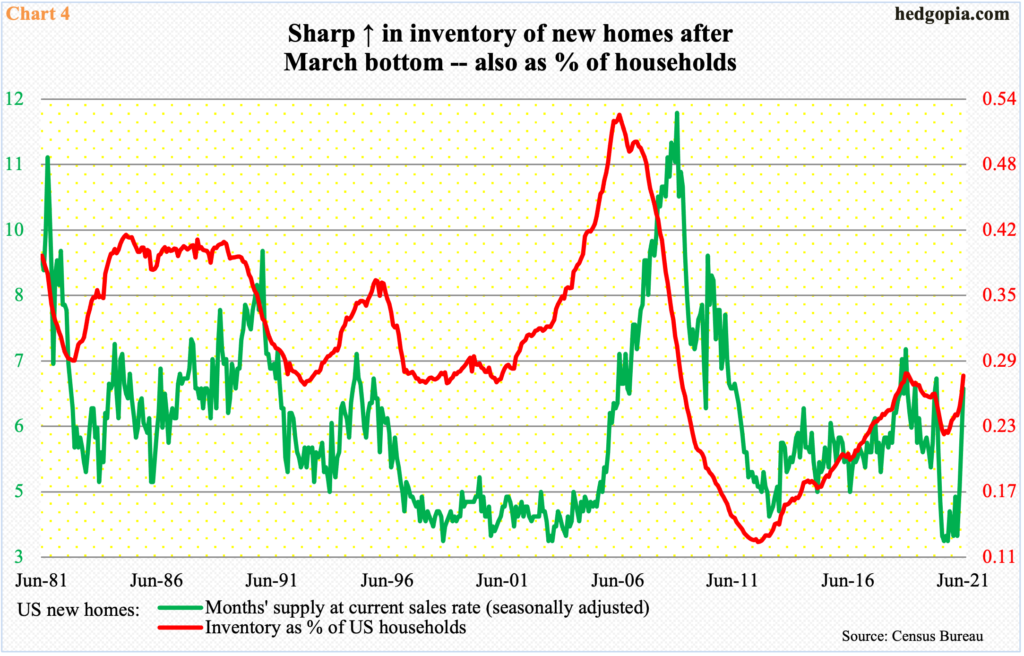
Increasingly, the sharp price appreciation is proving a deterrent to sales. Last October, there were 284,000 new homes for sale. By June, this had risen to 353,000; the last time supply was as high was in December 2008.
There has been a commensurate rise in home supply as a percent of households, with the green line in Chart 4 bottoming at 0.23 percent last August and rising to 0.28 percent last month.
In this environment, when the Fed decides to taper its bond purchases is hugely significant.
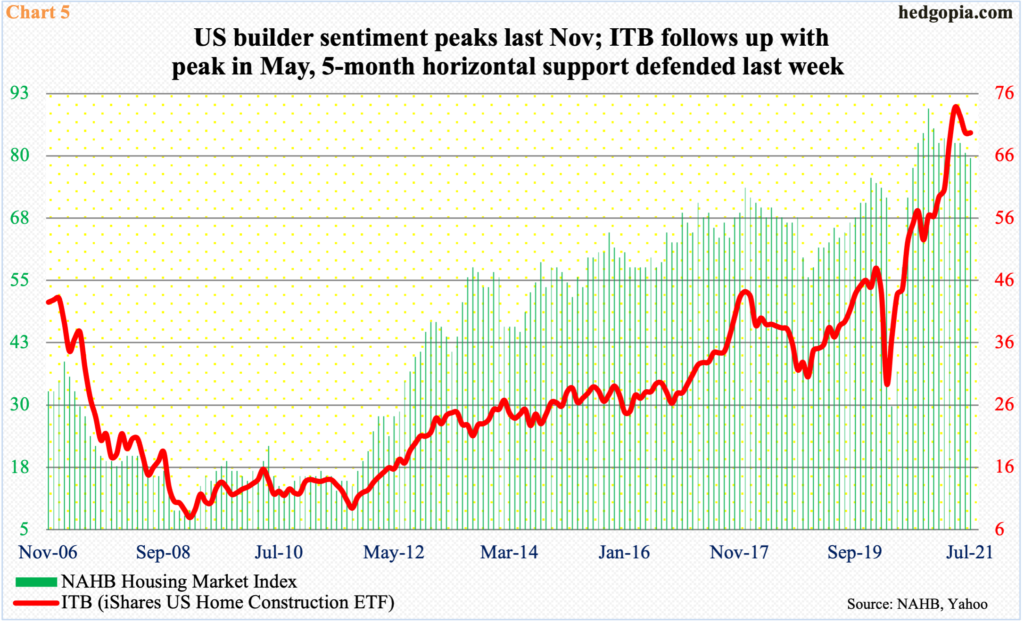
Amidst this, ITB (iShares US Home Construction ETF) retreated on May 10 after ticking $78.61. Earlier in November last year, the NAHB Housing Market Index reached a new high of 90, having tripled from April last year. This month, homebuilder optimism dropped a point m/m to 80.
Chart 5 does not capture ITB’s ($69.21) reversal candle in May as it uses the closing price. For now, bulls last week managed to defend important five-month support at $65. There is room to rally on the weekly, but longer-term, monthly indicators have a ways to go before overbought conditions are unwound.
Thanks for reading!
