Last week, the FOMC slightly tilted hawkish. Repercussions were felt across assets. Then early this week, dovish members were out in full force, pacifying investors that monetary morphine is here to stay; major equity indices are back at/near their highs. The so-called Fed put continues to push up valuation metrics, some of them dangerously so.
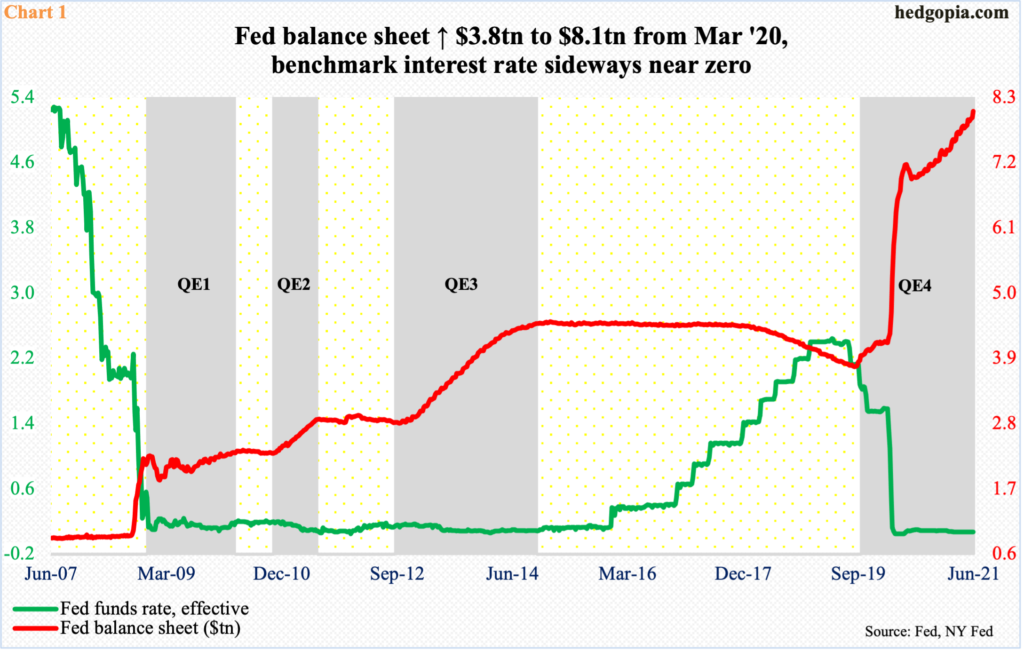
One of the primary reasons for equity bulls to maintain their positive posture is the monetary support provided by the Fed. Its balance sheet has grown from $4.24 trillion in early March last year to $8.1 trillion as of Wednesday last week (Chart 1).
The central bank continues to spend up to $120 billion a month in purchasing treasury notes and bonds ($80 billion) and mortgage-backed securities ($40 billion), even as the benchmark rate remains zero-bound. But members did bring forward their projections for interest rate hikes into 2023, with 11 of them penciling in at least two quarter-point increases in that year.
We are merely talking two rate hikes from essentially zero. And the planned hikes are still two years away. Still, repercussions were felt across assets. Equities were sold, long rates rose, the dollar was bid up and gold tumbled, among others.
Because of extended valuations, there is no shortage of trigger-happy longs, willing to lock in their gains first and ask questions later.
We saw this unfold last week. After Tuesday’s new intraday high of 4257.16, the S&P 500 quickly lost 2.1 percent in the remaining three sessions, slightly breaching the 50-day moving average. But as has been the case time and again since the large cap index put in a major low in March last year, those with the buy-the-dip mentality soon took over. By Wednesday (this week), the index ticked 4256.60, closing at 4242.
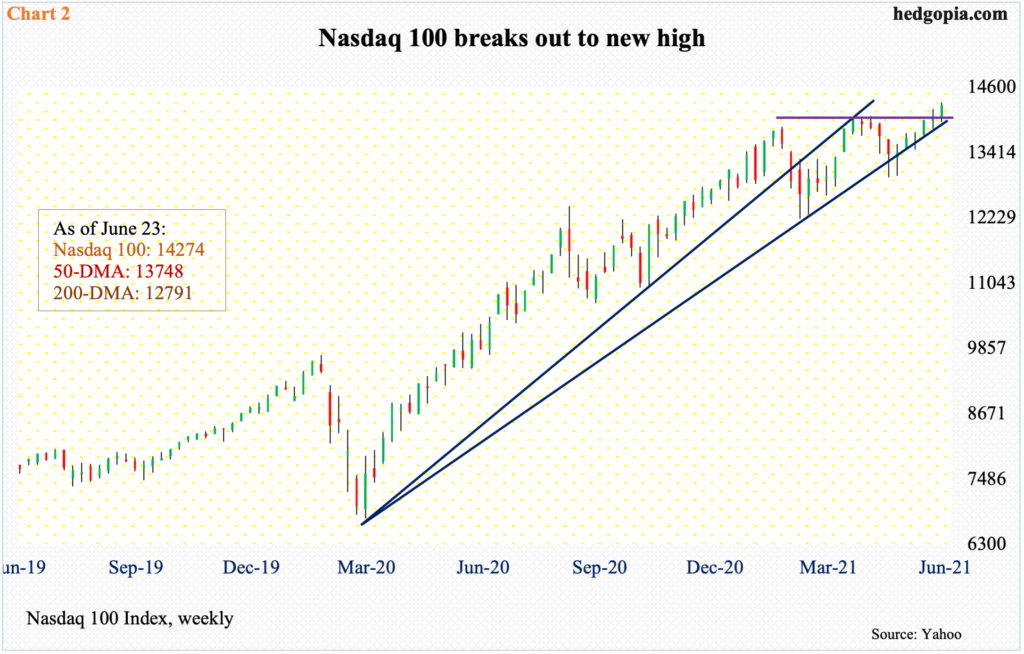
In fact, the Nasdaq 100 broke out to a new high this week (Chart 2).
On Monday and Tuesday, dovish members ranging from Fed Chair Jerome Powell and New York Fed President John Williams (NY Fed always votes in FOMC meetings) expressed the view that it is too soon to dial back the ongoing monetary support. District presidents of Dallas and St. Louis – Robert Kaplan and James Bullard – on the other hand argued that the time to pare back the bond-buying program is growing closer. Both currently do not vote, with Bullard becoming a voting member in 2022 and Kaplan in 2023. Right here and now, markets have decided to accord more currency to the dovish voices.
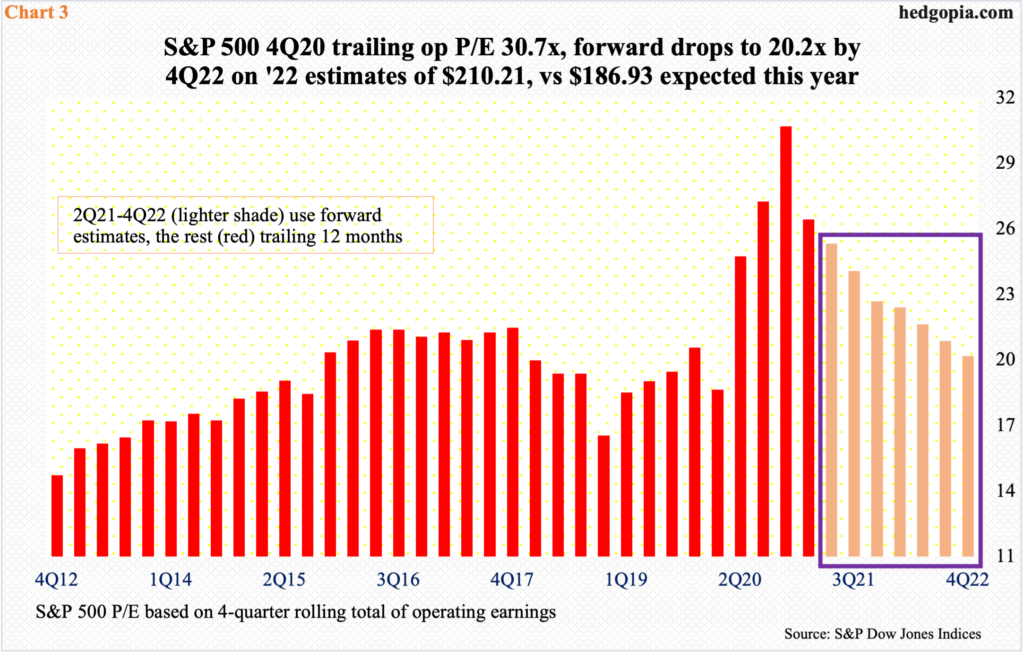
For a while now, the so-called Fed put has helped put upward pressure on valuation multiples, and this continues.
On a trailing 12-month basis, the operating price-to-earnings ratio for the S&P 500 rose as high as 30.7x in 4Q20, before dropping to 26.4x last quarter. The multiple continues to drop on forward earnings. On next year’s expected $210.21 in operating earnings, the index currently trades at 20.2x (Chart 3), which looks reasonable versus the 4Q20 high but these remain projections. When it is all said and done, they may or may not come about. The sell-side is notorious for starting out optimistic and pruning their numbers as the year progresses.
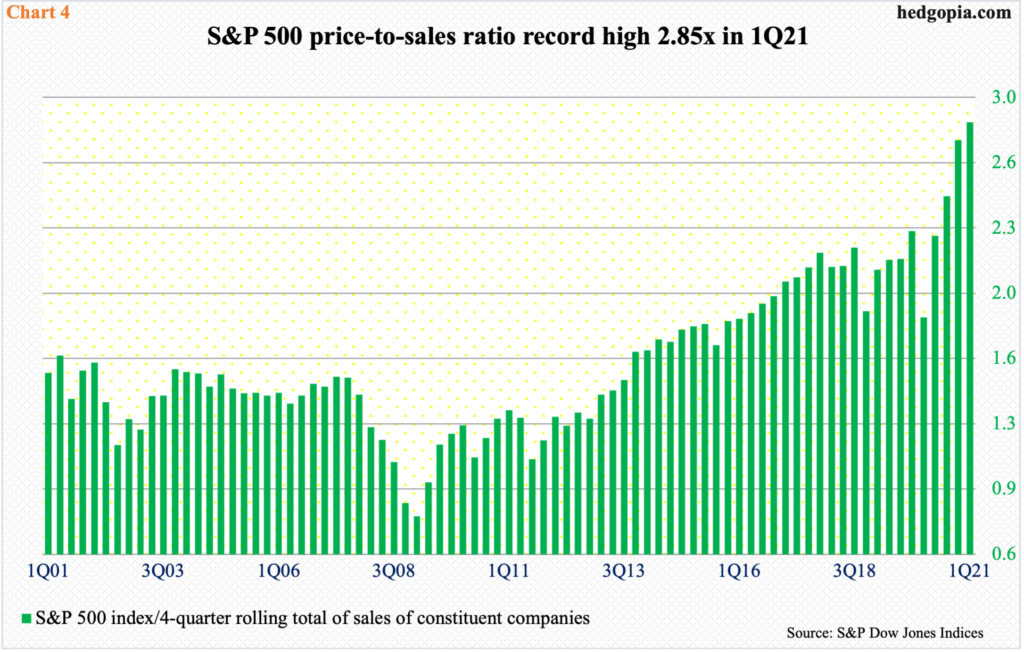
Valuations look stretched based on not only the bottom line but also the top line.
In 1Q21, the price-to-sales ratio for the S&P 500 posted a new record high of 2.85x (Chart 4). The post-pandemic low of 1.83x was reached in 1Q20, and has gone vertical since that low, which itself was not that depressed to begin with.
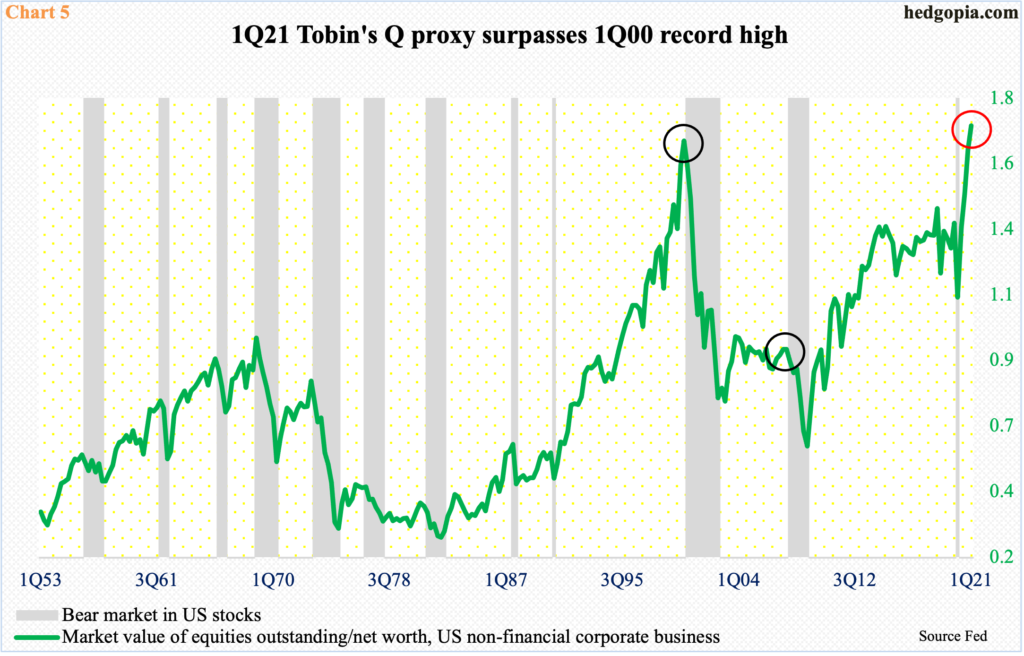
A Tobin’s Q proxy paints a similar picture.
Tobin’s Q is an investment concept propounded by the economist James Tobin. It compares an asset’s market value to its replacement cost.
Chart 5 generates a proxy by dividing companies’ market value by their net worth. In 1Q21, the market cap of US non-financial companies was $45.1 trillion versus $26.2 trillion in net worth, resulting in a ratio of 1.72, which overtook the prior high of 1.67 from 1Q00. Four quarters ago, the ratio languished at 1.12. The rise since has been nothing short of parabolic.
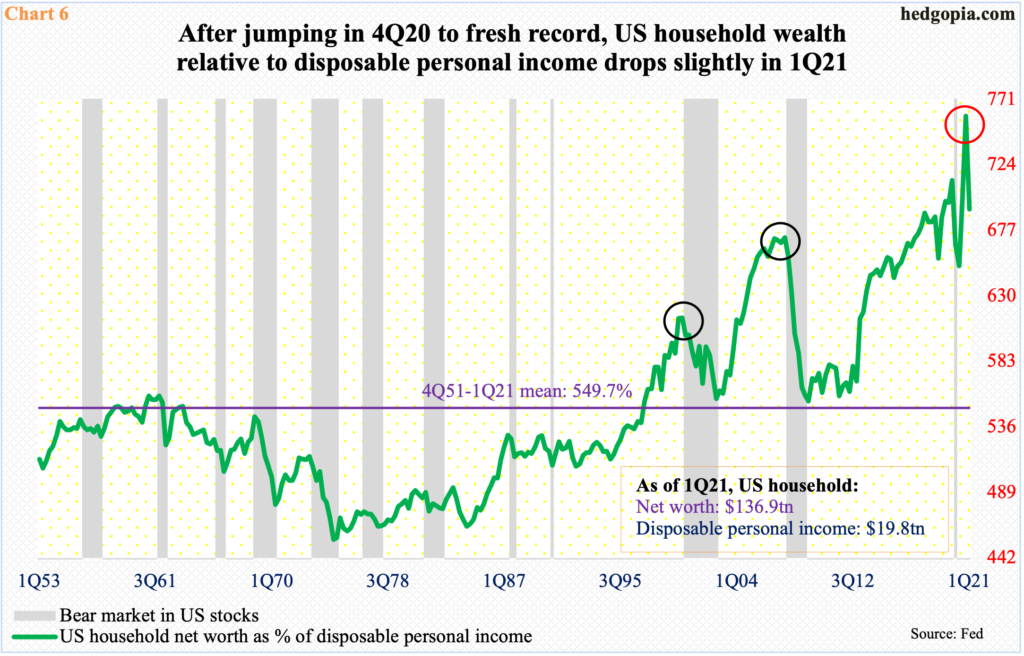
As far as households are concerned, apart from record equity allocation (chart here), the gap between wealth and income surged to a record high in 4Q20 before dropping slightly in the last quarter.
Household net worth hit $136.9 trillion in 1Q21, up $5 trillion from 4Q20; disposable personal income grew $2.4 trillion to $19.8 trillion between the periods. One look at Chart 6 and it is obvious wealth has been growing much faster than income.
Household net worth as a percent of disposable personal income rose to a record 759 percent in 4Q20 before sliding to 692 percent in 1Q21. For reference, the average going back to 4Q51 is 550 percent.
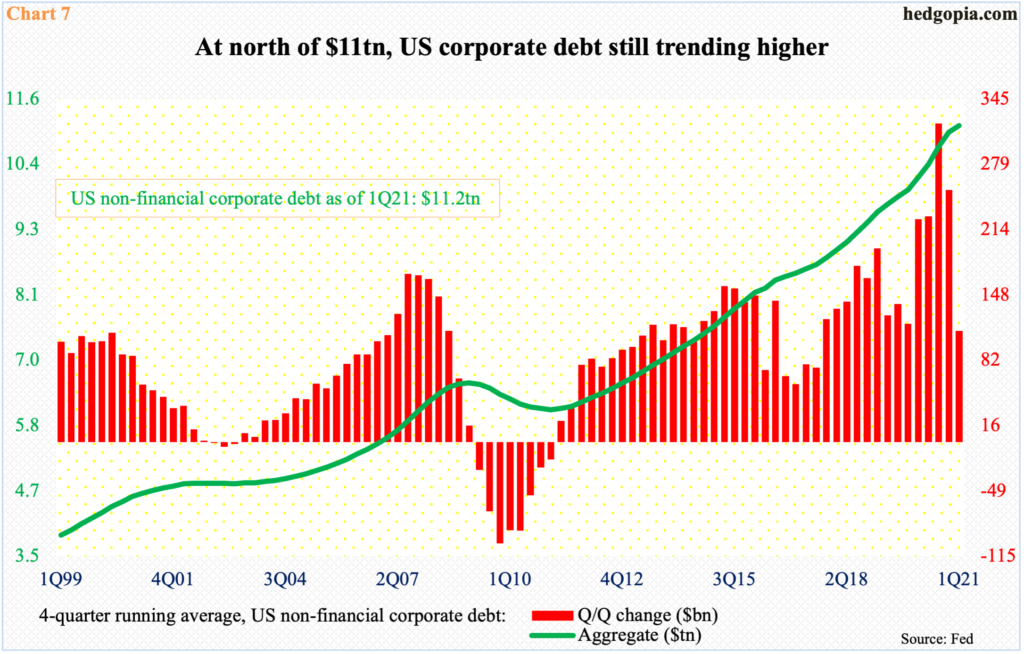
On the corporate front, debt accumulation is getting excessive – to a point when non-financial companies were sitting on record outstanding debt in 1Q21. At $11.2 trillion, corporate debt has been north of $11 trillion the last four quarters.
A four-quarter average helps us get a sense of the underlying trend, and it has been nothing but up on that score – from bottom left to upper right (Chart 7).
In 2020, US corporate bond issuance set a new record at $2.3 trillion, comprised of $1.9 trillion in investment-grade and $422 billion in high-yield. This year, with five months in, they are respectively tracking at $2.3 trillion, $1.7 trillion and $625 billion (chart here).
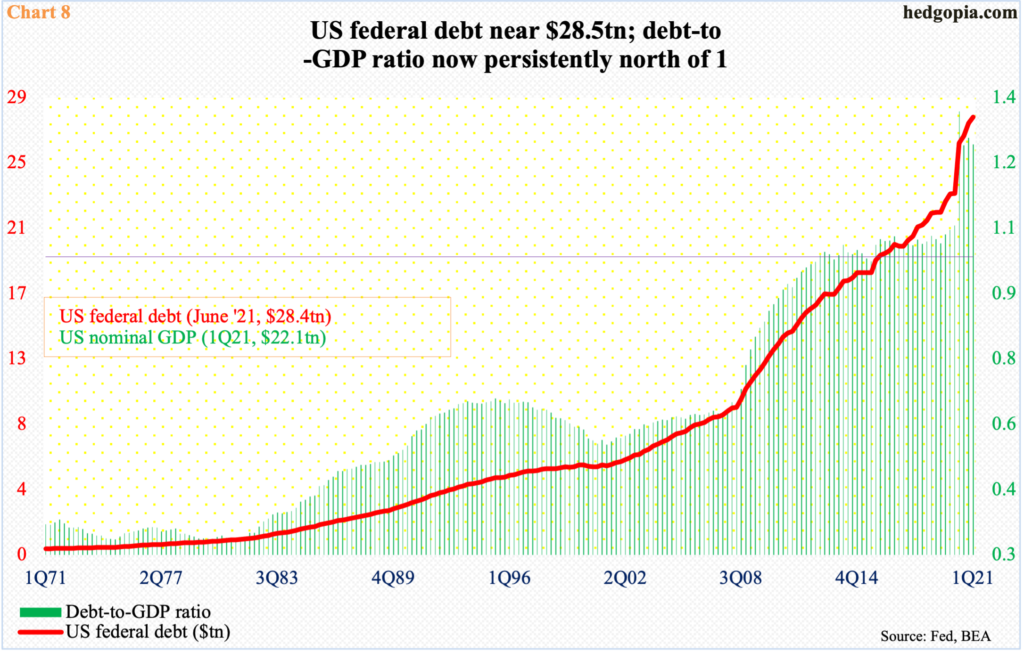
Debt binge is worse at the federal level.
In 2020, the US national debt, currently $28.4 trillion, shot up $4.5 trillion. Chart 8 uses the 1Q21 number, when it was $28.1 trillion; with nominal debt at $22.1 trillion during the quarter, the debt-to-GDP ratio registered 1.28, which was less than the all-time high of 1.36 recorded in 2Q20 but the ratio has been north of one for 22 quarters straight – and in 31 of the last 34 quarters, with the remaining three quarters at 0.993 percent, 0.996 percent and 0.998 percent, which is essentially unity (Chart 8).
The point is that the government’s reliance on debt has gotten so excessive you begin to wonder if it has reached a point of diminishing returns.
This can also apply elsewhere. Equities have done phenomenally well in recent years. Just since the low of March last year, the S&P 500 is up more than 93 percent, driving one after another metric into uncharted territory. You then wonder if these returns are borrowing from the future, negatively impacting performance in the outer years.
Thanks for reading!

