
Three months. That is all it took for the Fed to do a 360.
In the middle of last December, the fed funds rate was raised for the first time in nine years – to still-zero-bound 37 basis points. The FOMC’s dot plot expected to hike four more times this year. Fast forward to this week’s FOMC meeting, and members now expect two hikes.
From hawkish to dovish in no time, the message of the Fed’s message is hazy at best.
What exactly is the Fed watching? Remember, it has a dual mandate of maximum employment and price stability.
Jobs? If the Fed were solely focused on employment, rates would no longer be zero-bound, rather a lot higher.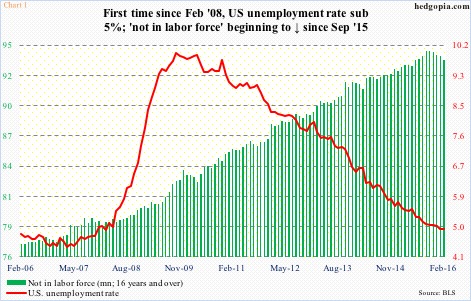
Post-Great Recession, economic growth has been sub-par. No question. From the perspective of unemployment rate, though, progress has been decent – which has fallen from a high of 10 percent in October 2009 to 4.9 percent in both January and February.
Now, as Chart 1 shows, one of the reasons the unemployment rate has dropped is the persistent, and unhealthy, rise in the number of people dropping out of the labor force. That said, since the recovery began nearly seven years ago, 12.5 million non-farm jobs have been created, for a total of 143.6 million. A total of 5.1 million jobs has been added from the prior peak in January 2008.
Inflation, then? Previously, inflation – or a lack thereof – gave the Fed a lot of leeway in staying accommodative as pricing pressure was non-existent.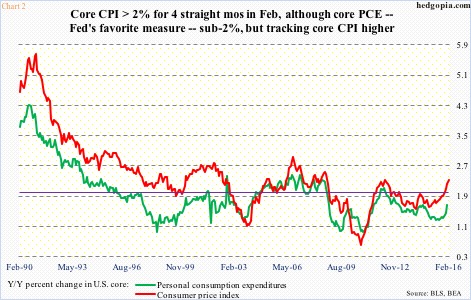
The last time core PCE (personal consumption expenditures) increased at north of two percent annually for five consecutive months was September 2008. Last July, growth dipped to 1.26 percent, and has been rising since, with January at 1.67 percent, but still below the Fed’s two-percent goal.
Here is the thing. Core consumer price index has risen at north of two percent for four straight months now, with February’s 2.33 the largest since September 2008. Directionally, core PCE has been following core CPI higher (Chart 2). Inflation is not a worry – far from it – but the trend can be.
If the focus was just on employment and inflation, it is hard to justify this week’s switch from hawkish to dovish.
What else could it be watching?
It is probably watching the U.S. dollar. It is watching Mario Draghi, ECB president, and Haruhiko Kuroda, BoJ governor, indulge in competitive devaluation. And it is watching U.S. exports tumble.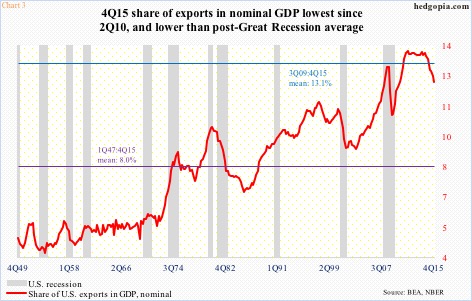
The U.S. exported $2.36 trillion worth of goods and services in 3Q14 (SAAR). By 4Q15, this had dropped to $2.21 trillion, even as nominal GDP grew from $17.52 trillion to $18.15 trillion. Exports’ share in nominal GDP has dropped from 13.7 percent in 4Q13 to 12.2 percent (Chart 3).
Potentially worrisome: In the past, persistent weakness in the red line in Chart 3 has accompanied contraction in the economy. The dollar’s uptrend has got to be broken.
Between July 2014 and March 2015, it rallied nearly 26 percent (Chart 4). In doing so, it retraced nearly 61.8 percent of the July 2001-April 2008 decline – always a good spot for a pause/reversal of the prior trend.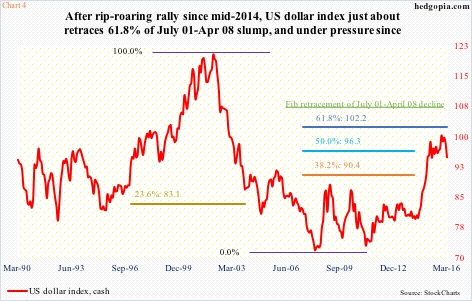
But the dollar index refuses to die down. It has more or less been going sideways since that peak, staying within a wide range. Anytime markets place higher odds on a rate hike, the index rallies. If on Wednesday the Fed maintained its hawkish stance, the dollar index would probably rally. More worry for U.S. exports. Instead, it dropped two percent on Wednesday and Thursday.
And, last but not the least, the Fed is watching stocks. This is a Fed – and its predecessor – that is married to the virtues of wealth effect.
The three iterations of QE did wonders to U.S. stocks. Look at the near-perfect correlation between the S&P 500 and QE in Chart 5. After QE3 ended in October 2014, there have been two decent corrections in stocks (arrows). Each time, the Fed has responded with a dovish message.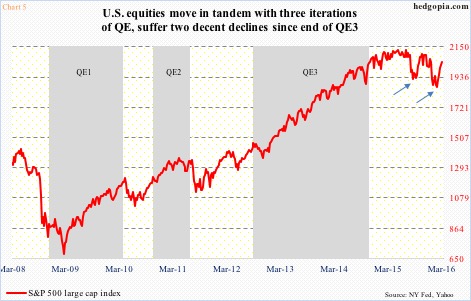
The Fed wants inflation – in both assets and consumer prices. It has succeeded in the former, but not much in the latter.
That said, if the recent trend in both core PCE and CPI is a sign of things to come, higher inflation would go a long way in effectively eroding the value of the nation’s debt.
By 4Q15, total U.S. credit market debt outstanding stood at $63.5 trillion – $9 trillion more than seven years ago. That was when the Fed went ZIRP and QE.
Thanks for reading!
