
The sharp decline in US stocks last October-December forced the Fed to do a 360 as relates to its campaign to tighten monetary policy. The dovish shift apparently wants to unleash animal spirits. Investors have obliged – thus far. Will it continue? Better yet, what if it is not long-lasting?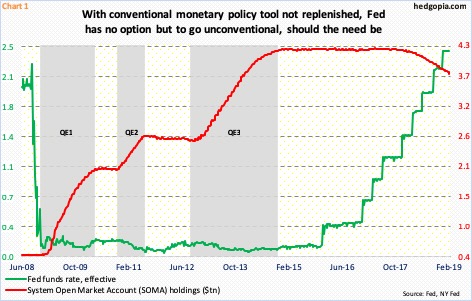
It did not take much for the Fed to bid adieu to its hawkish bias.
On October 3 last year, US stocks in general began what soon turned out to be a waterfall dive. On that same day, Jerome Powell, Fed chair, said interest rates were still “a long way” from neutral. Deeply overbought stocks were not in a mood to hear that. They tumbled, forcing the central bank to rethink its tightening bias. On November 28, Powell said interest rates were “just below” neutral. In the dying weeks of 2018, his speeches had decidedly taken on a dovish turn.
In the December 18-19 meeting, the FOMC went on to raise the fed funds rate by 25 basis points, to a range of 225 to 250 basis points. This was the ninth hike since December 2015 when rates rose after remaining near zero for seven long years (Chart 1). There are seven more scheduled FOMC meetings this year. In the futures market, the Fed is expected to stay pat in all these meetings.
In the meantime, minutes from the January 29-30 meeting showed last Wednesday FOMC members plan to stop reducing the balance sheet later this year. In the wake of the financial crisis of a decade ago, the Fed’s SOMA (System Open Market Account) holdings went from under $500 billion in December 2008 to $4.24 trillion in April 2017. In October that year, it began to run down its bloated balance sheet. As of last Wednesday, it was down to $3.78 trillion, down $118 billion in the past three months. At this pace, it would have dropped to still-massive $3.4 trillion – give and take – by the end of the year. Despite this, the Fed wants to stop the so-called quantitative tightening, and, if the need be, expand the balance sheet. The question is why?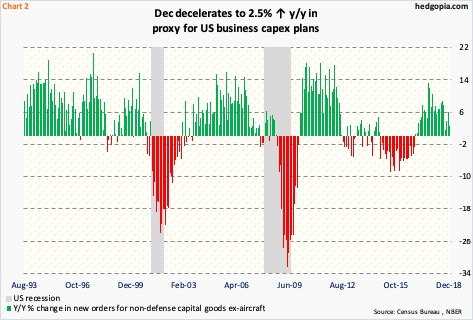
Without question, macro data have decelerated over the last several quarters. Real GDP expanded 4.2 percent in 2Q last year, followed by 3.4-percent growth in 3Q. As of last Thursday, the Atlanta Fed’s GDPNow model is forecasting growth of 1.4 percent in 4Q (the first, and second, official estimate is due out Thursday).
Chart 2 plots the year-over-year change in orders for non-defense capital goods ex-aircraft. This series can be used as a proxy for businesses’ capex plans. It is in deceleration. Orders grew 2.5 percent in December – a three-month low. As recently as last July, orders grew 8.8 percent, having peaked at growth of 13.3 percent in September 2017.
The point is, most data points have been softening for a while now. But it was not until recently the Fed made that hawkish-to-dovish switch. The risk in this is that this sends a bad signal to corporate CEOs. They know the conventional monetary quiver does not have sufficient arrows. The Fed obviously knows this. Hence FOMC members’ desire to use – once again – the balance sheet as a tool, if the need be, and hope investors’ animal spirits are unleashed.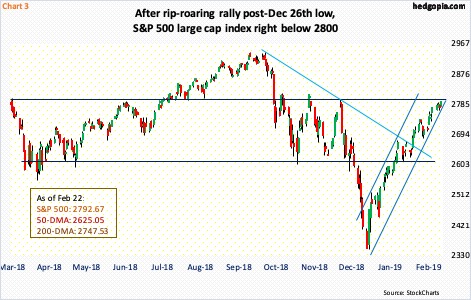
Thus far, this is precisely how things have evolved.
Stocks took it on the chin in October-December. The S&P 500 large cap index fell 20.2 percent before bottoming on December 26. From that low, it has witnessed quite a rally, up 19.1 percent through last Friday’s intraday high.
In the process, the index has not only recaptured the 50- and 200-day moving averages but also 2600-2630, rallying all along a sharply rising channel (Chart 3). It currently finds itself right under major resistance at 2800. For most of last year, the S&P 500 (2792.67) went back and forth between 2800 and 2600. A breakout can at least take out stops, potentially adding to gains.
Along the same lines, the Russell 2000 small cap index (1590.06) and the Nasdaq 100 index (7090.62) are both just under crucial resistance at 1600-plus and 7100-plus, in that order.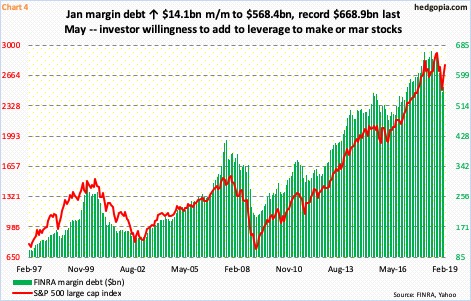
Despite the massive gains in stocks the past couple of months, flows are yet to cooperate. Since the week ended December 26 through last Wednesday, Lipper data show, $17.2 billion came out of US-based equity funds. Since the week ended October 3, $125.2 billion has been withdrawn. Concurrently, as per ICI, money-market-fund assets have ballooned to $3.07 trillion, up $201 billion since early October. No animal spirits here. Not yet anyway.
FINRA margin debt rose in January but in a rather muted fashion. The S&P 500 jumped 7.9 percent in January, margin debt rose $14.1 billion, to $568.4 billion (Chart 4). This was the first up month in six. From the all-time high of $668.9 billion last May, margin debt is down north of $100 billion, but remains massive. For stocks to do well, leverage needs to increase.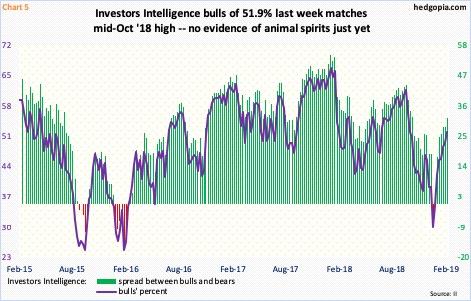
This is also true with investor sentiment.
Early October last year, when stocks were peaking, 61.8 percent of newsletter writers were bullish. Historically, this was a very high reading (Chart 5). As stocks sold off, bulls by early January dropped to 29.9 percent. Last week, their count rose 2.4 percentage points week-over-week to 51.9 percent; the bull-bear spread expanded to 31.2 percent – a 17-week high.
Since the late-December low in stocks, there has been a nice uplift in sentiment, but bulls are not snorting just yet. For an optimist, this probably means there is room for it to rise toward high-50s/low-60s, a pessimist at the same time would label the two-month rise as subdued despite the rip-roaring rally in stocks.
How investor sentiment behaves will impact whether or not there is a rise in leverage.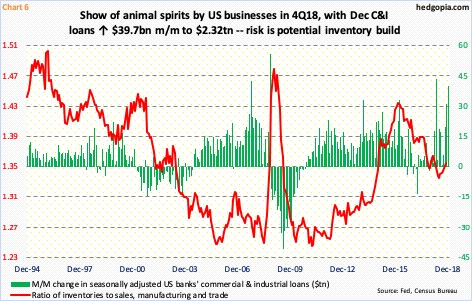
From margin debt to bank loans, leverage needs to cooperate in order for animal spirits to get rekindled – be it markets’ or the overall economy’s.
In this respect, banks’ commercial & industrial loans jumped $90.1 billion in 4Q, with December up $39.7 billion to a seasonally adjusted annual rate of $2.32 trillion (Chart 6) – a new high. This is a show of animal spirits on the part of businesses. The risk is a buildup in inventories. Should growth continue to falter, the inventories-to-sales ratio, which has been rising since last July, can continue higher.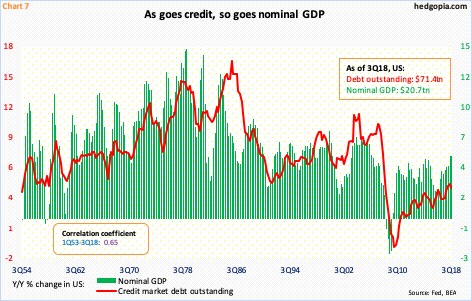
Leverage and the US economy go together. This is not some recent phenomenon. The correlation between total debt outstanding and nominal GDP is highlighted in Chart 7. This is the reason why investors have so far cheered the prospects of easier credit conditions, not to mention the possibility at some point in the future of quantitative easing (QE). In a scenario in which the Fed feels the need to breathe new life into the wealth effect, it has no other option. During the three iterations of QE post-financial crisis, stocks did phenomenally well.
There is this, though. Hindsight is always 20/20, but after all that money creation and QE, as it turns out, we are back to square one. Overall, leverage is up. And the economy could be vulnerable, as shown by the Fed’s hawkish-to-dovish switch. The risk thus is of subdued animal spirits in months and quarters to come. Post-crisis a decade ago, stocks got clobbered to multi-year lows, which made it easier for investors to find their animal spirits. Now, stocks are within striking distance of all-time highs. This changes the risk-reward dynamics.
Thanks for reading!
