
The Fed is in a tight spot.
Yesterday, on the day it told us it continues to have a slight tightening bias it published capacity utilization and industrial production for May. Utilization dropped 0.4 percent month-over-month to 74.9 percent, a full four points lower from the cycle high 78.9 percent in November 2014.
May was the 15th consecutive month utilization dropped year-over-year. The U.S. economy is about to complete seven years of expansion. Fatigue is setting in.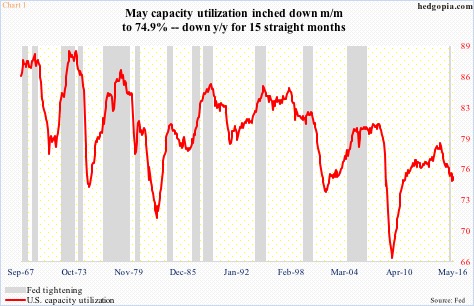
Nevertheless, in December last year, with its back against the wall and needing to fill its empty monetary quiver with conventional arrows, the Fed raised the fed funds target rate to between 25 and 50 basis points. This was a first hike in nearly 10 years. Oddly, this took place even as utilization had already peaked and was on its way down. This is very rare (Chart 1).
In the meeting yesterday, the Fed maintained the status quo. This was expected. But the FOMC’s dot plot showed nine members expect two hikes this year. Importantly, six see only one 25-basis-point hike as appropriate this year, versus just one in March.
At least in theory, a July hike is possible, but probably only if June prints a strong jobs number combined with a ‘no leave’ Brexit vote.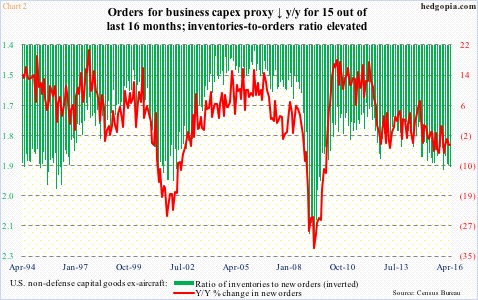
The Fed is wanting to tighten amidst weakening economic data. Its own forecast went down yesterday, trimming estimate of U.S. growth this year to two percent from 2.2 percent. This is in line with the consensus forecast.
Just last week, the World Bank’s forecast for the U.S. this year was cut from 2.7 percent to 1.9 percent. The U.S. economy grew 2.4 percent last year. Things are not accelerating.
The FOMC statement yesterday noted that “business fixed investment has been soft.”
Chart 2 plots orders and inventories for non-defense capital goods ex-aircraft – a proxy for business capX – and the trend is rather disturbing, with the former down and the latter up. Orders declined m/m in April to a seasonally adjusted annual rate of $62.4 billion, for a third straight monthly drop. Y/Y, they were down in 15 out of the last 16 months. Orders peaked at $70.7 billion in September 2014. Plus, the inventories-to-orders ratio remains elevated.
Lackluster capital investments do not make for healthy productivity growth.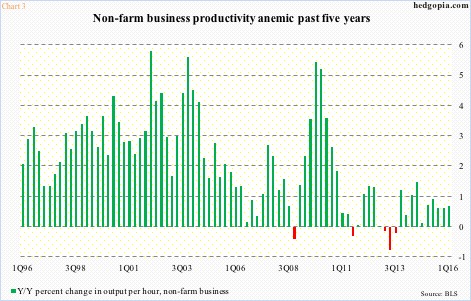
One of the hallmarks of the current recovery has been disappointing output per hour, up a mere 0.67 percent y/y in 1Q16, and up 0.61 percent each in the prior two quarters. In the past six quarters, productivity has managed to only grow sub-one percent, remaining suppressed the past five years (Chart 3).
Increase in the workforce and productivity of that workforce pretty much determine long-term growth. Low productivity then reverberates through wages, which remain sluggish.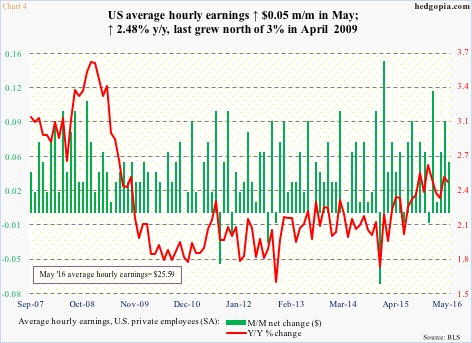
In May, average hourly earnings of private-sector employees rose five cents m/m to $25.59. Y/Y, they grew 2.48 percent, shifting down from growth of 2.64 percent last December. As is seen in Chart 4, historically these are very low growth rates. In fact, the last time hourly earnings grew at a rate of three percent or more was in April 2009.
Employees’ share of national income remains historically low. This is bound to impact the afore-mentioned utilization. Consumers make up nearly 70 percent of the economy.
And the cycle goes on. Once in, it is difficult to get out.
As much as the Fed may want to sound/act hawkish, Michael Corleone’s “Just when I thought I was out, they pull me back in” in Godfather III is apropos here.
Thanks for reading!
