
Most valuation metrics in US equities are stretched. This at a time when the Fed is tightening. Depending on how inflation behaves in the months and quarters ahead and how monetary policy evolves, unwinding of overbought conditions can cause pain.
Quantitative easing (QE) helped equities. As the Federal Reserve aggressively purchased treasury securities, investors moved up the risk curve to invest funds accrued thereof – plus others – setting in motion a chain reaction. Now, the reverse is at work.
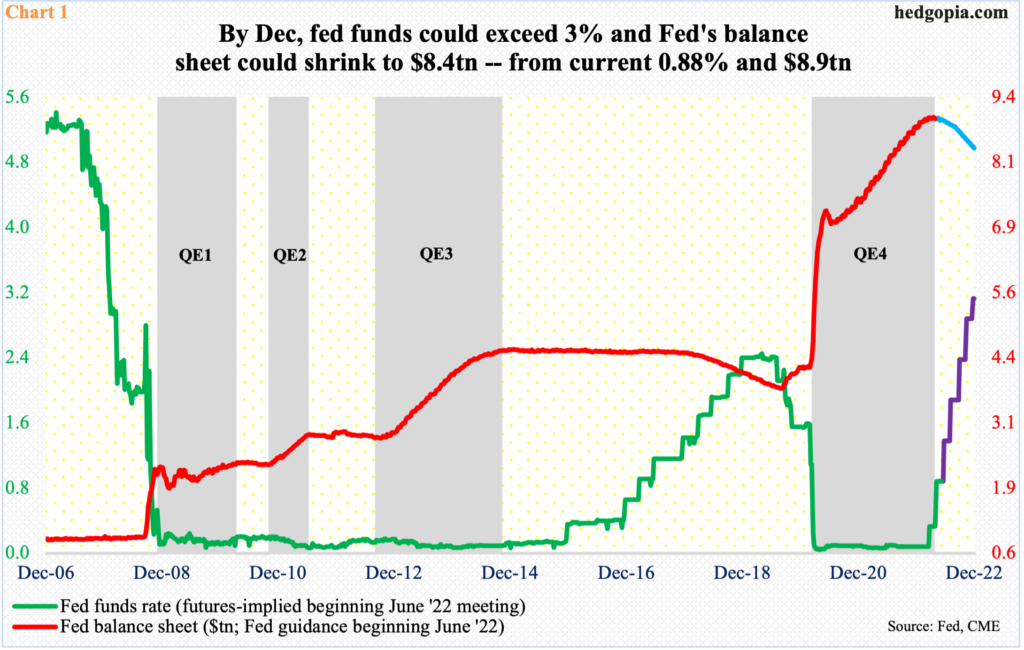
QE has been replaced by quantitative tightening. The central bank is using both conventional (benchmark rates) and unconventional (balance sheet) tools to bring four-decade-high consumer inflation under control.
The fed funds rate has been raised twice this year – by 25 basis points in March and 50 basis points in May, to a range of 75 basis points to 100 basis points. In the futures market, traders are betting rates would reach north of three percent by December (Chart 1). Concurrently, the central bank is reducing its assets, which is guided to hit $8.4 trillion by year-end from the current $8.9 trillion.
Investors are readjusting their portfolios. Risk-off sentiment is on the rise. One of the places where this is evident is high-yield, which pays higher interest rates than investment-grade and carry default risks during tough economic times.
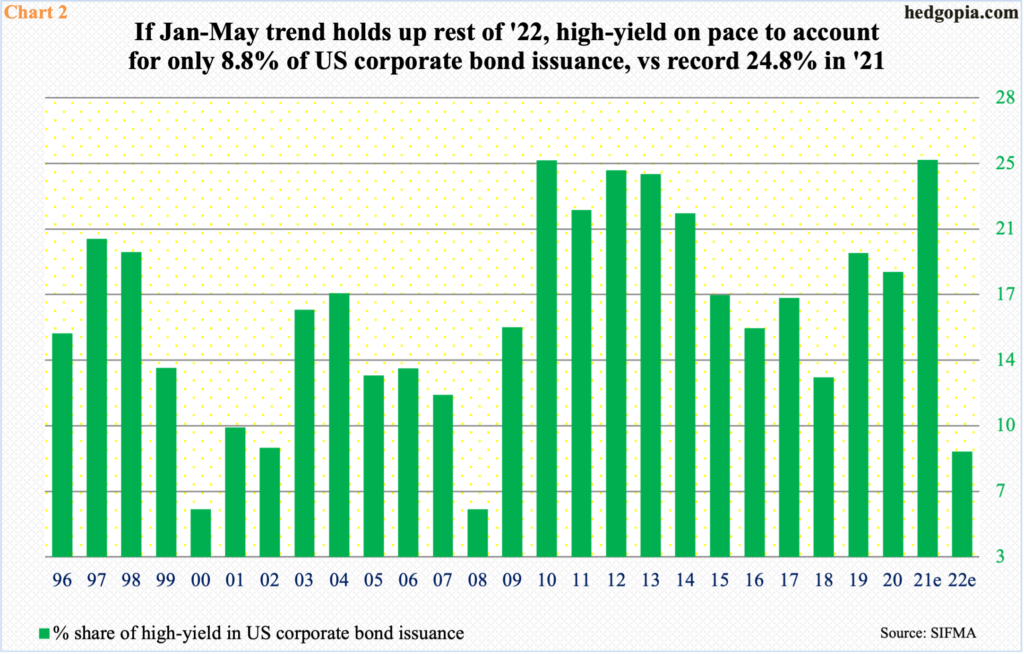
In the first five months this year, demand for high-yield, also known as junk, collapsed – for total issuance of $64.6 billion, versus $260.2 billion in the comparable period last year. At the current pace, corporations will have issued $155 billion worth this year, which pales in comparison to last year’s record $485 billion.
If the January-May pace holds up for rest of the year, high-yield’s share in total corporate bond issuance would equal 8.8 percent, versus last year’s record 24.8 percent. This will be the lowest share since cratering to 5.6 percent in 2008 (Chart 2).
Risk-off sentiment is also showing up in US equities, which have come under pressure this year. But they are selling off from a very elevated level. From the March 2020 low through the January (this year) high alone, the S&P 500 large cap index surged 120 percent, driving most metrics into stratosphere.
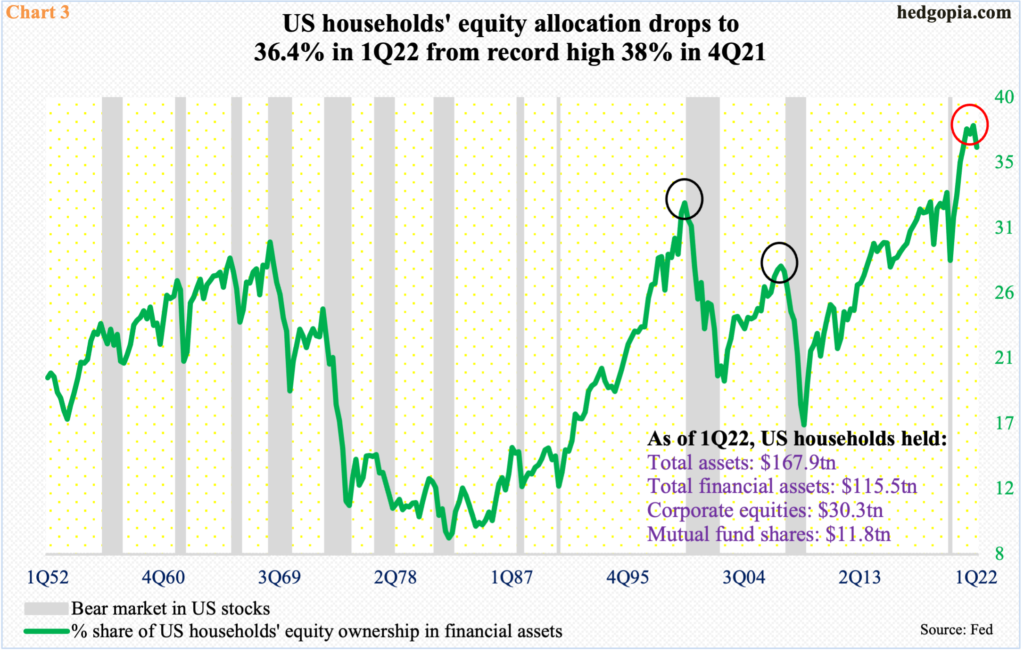
Take households’ equity allocation. In 4Q21, the metric hit 38 percent – a fresh record. In the subsequent quarter, it dropped to 36.4 percent, but remains way extended historically. In both 2000 and 2007 – and even 2020 – once the green line in Chart 3 peaked, it then declined on a sustained basis. Currently, equities’ allocation is higher than when the metric began to correct in all those three times. Sustained unwinding will not be pretty.
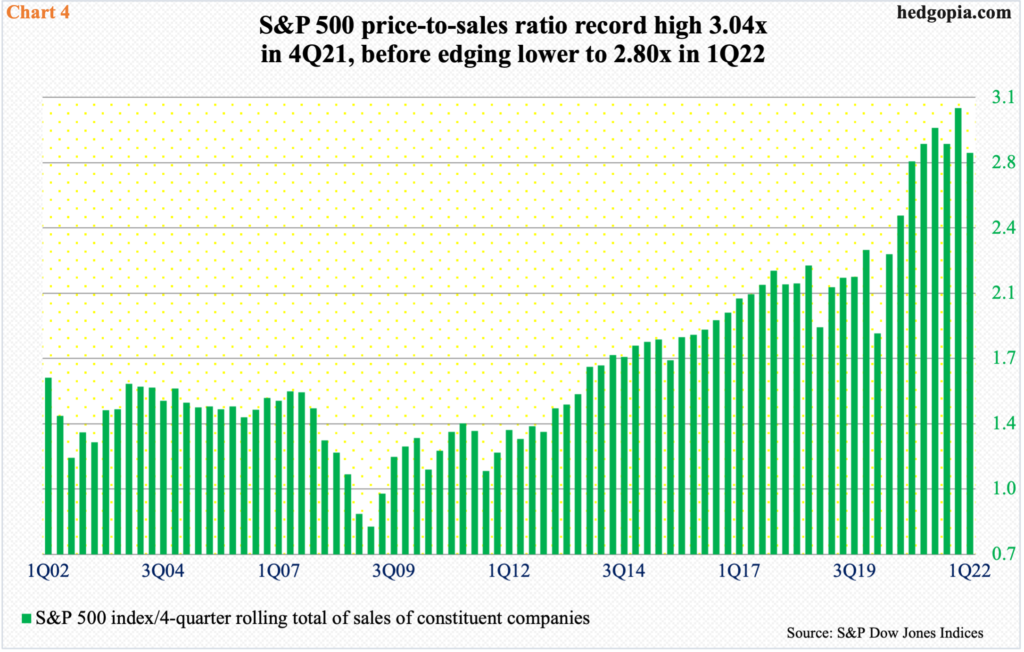
The price-to-sales ratio in the S&P 500 is another metric highlighting the built-in excesses.
In 4Q21, the ratio hit 3.04x, before coming under pressure a tad in 1Q22 to 2.80x (Chart 4). Nothing says it cannot continue higher. It has in the past. As recently as 1Q20 when the S&P 500 reached a major low, the ratio bottomed at 1.83x, which was already extended historically, before going vertical.
But the rubber band can only be stretched so far before it snaps.
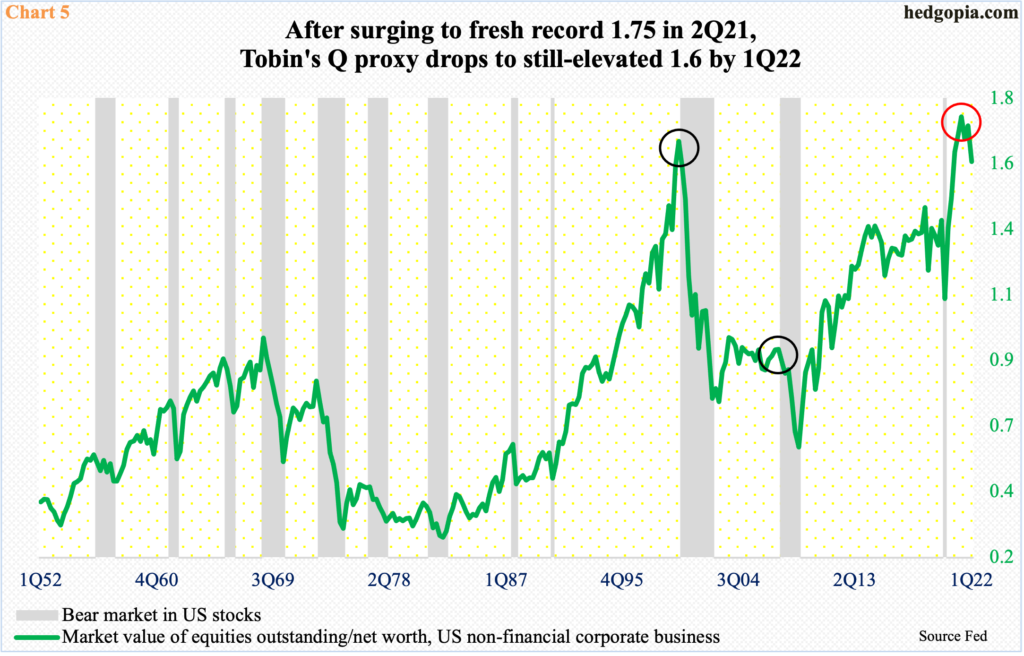
Tobin’s Q is a popular investment concept. Propounded by the economist James Tobin, it compares an asset’s market value to its replacement cost. Chart 5 creates a proxy of Tobin’s Q by dividing US companies’ market value by their net worth.
In 2Q21, the market cap of US non-financial companies stood at $48.3 trillion against $27.5 trillion in net worth, for a ratio of 1.75. Both these variables continued to rise in the subsequent quarters, with the former hitting $51.5 trillion in 4Q21 and the latter $30.1 trillion in 1Q22. The ratio dropped to 1.6 last quarter and, if past is prelude, may have a ways to go on the downside before it stabilizes.
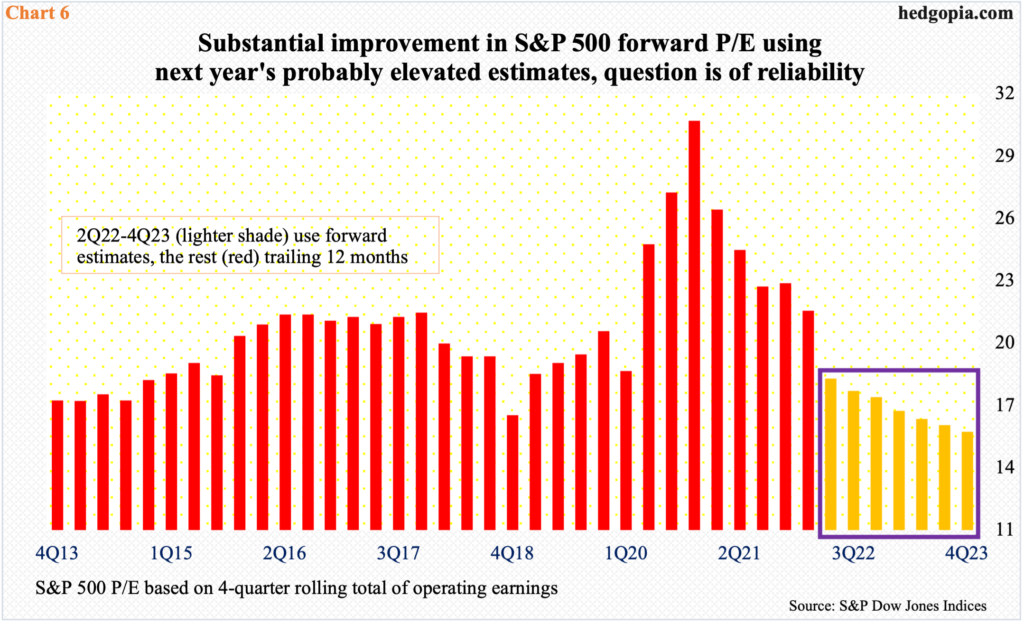
The price-to-earnings ratio similarly is correcting and even beginning to look reasonable on next year’s earnings, but it is anyone’s guess if these estimates reflect reality.
In 4Q20, the P/E using trailing 12-month operating earnings of S&P 500 companies rose as high as 30.7x. By 1Q21, this improved to 21.6x but was still elevated.
With three quarters to go this year, these companies are expected to bring home $224.24 in 2022 and $247.85 in 2023. Estimates for both years peaked late April at $227.51 and $250.12, in that order. The way the US economy is evolving and showing signs of deceleration, it is probable the downward revision trend for next year’s will continue and get a nice haircut. The current forward P/E of 15.7x using next year’s estimates hardly induces conviction (Chart 6).
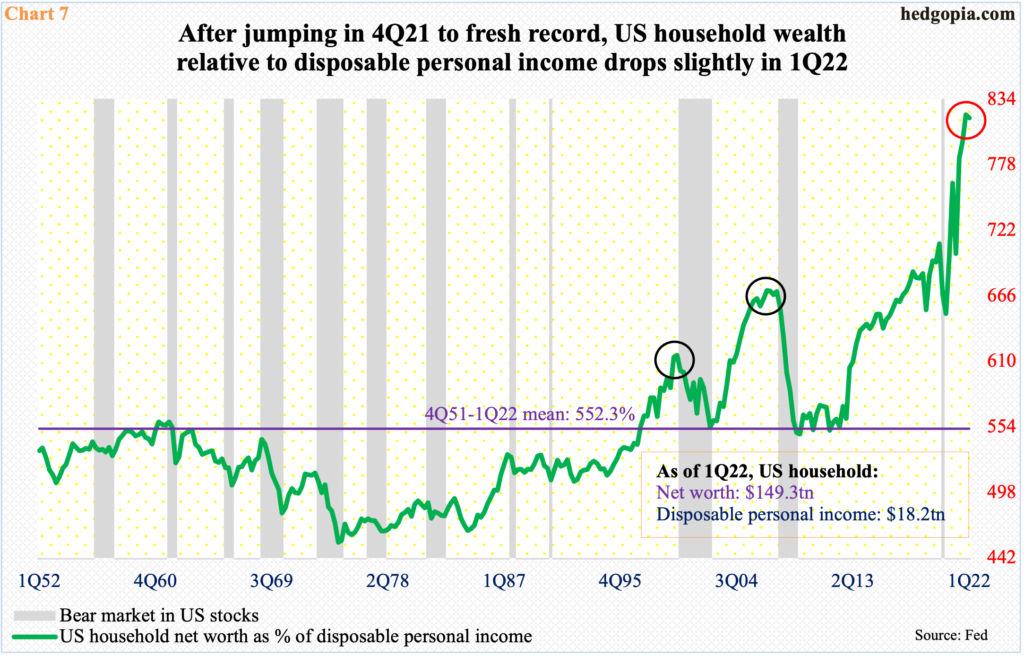
Last but not the least, Chart 7 highlights the unsustainable way US household wealth has grown.
In 4Q21, household net worth totaled $149.8 trillion – a record; disposable personal income peaked earlier in 1Q21 at $19.5 trillion. In 1Q22, net worth was $149.3 trillion and income $18.2 trillion. Growth in the former is not being matched by the latter. As a result, the green line in the chart, which calculates household net worth as a percent of disposable personal income, surged to a new high 821 percent in 4Q21, with a slight drop to 818 percent in 1Q22.
This is obviously record territory, or close to it. One look at the chart and it is clear how extended this metric is. If – big IF – the quarter-over-quarter drop in 1Q22 is the beginning of a sustained drop, the prevailing bear market in equities is far from over.
Thanks for reading!
