
The U.S. factory report out yesterday has ignited a ray of hope.
Orders for non-defense capital goods ex-aircraft (proxy for business capital expenditures) in particular were revised higher. March went from $68.19 billion to $68.71 billion, and February from $68.54 billion to $68.65bn.
On an absolute level, we are looking at a tiny sum, but on a relative level, it just might be what this series needs.
Prior to the revision, orders were down for seven consecutive months. With the revision, March is now up 0.1 percent month-over-month. The last time orders rose in this category was last August; it is a first m/m increase in six months.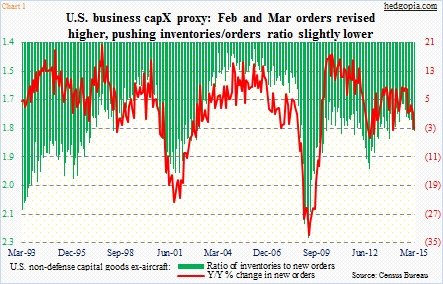
Year-over-year, however, orders were still down 3.2 percent in March – the first y/y decline since January 2014. Considering that orders were strong last year up until this past February, y/y change likely will continue to remain in the red for at least several more months. April, for instance, was $70.2 billion last year. In order to have y/y growth in April (last month), orders would need to grow at least 2.2 percent over March. A tall order given the lack of momentum in recent months. March orders are down six percent from the August high of $73.11 billion.
The good thing is, the downward momentum has been broken.
Also, there was progress on the inventory front. Inventories rose as well, but less than orders – March was revised higher from $122.96 billion to $123.05 billion, and February from $122.72 billion to $122.76 billion. As a result, the ratio of inventories to orders remained unchanged at 1.79 m/m (Chart 1).
Nonetheless, the trend in the green bars in Chart 1 is going the wrong direction. The ratio was 1.67 last June. It is possible things will look different when April numbers are reported.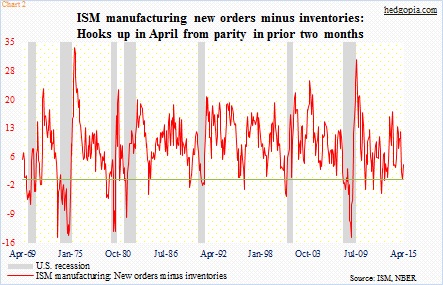
In the ISM manufacturing report last week, orders rose 1.7 points to 53.5 in April, while inventories shrank two points to 49.5 – the first sub-50 reading after last July (Chart 2). It is just one data point, and too soon to get overly excited about. After all, Chart 3 highlights the buildup in inventories in manufacturing and trade, but the red line reflects data as of February. As well, the 1Q GDP report showed inventories (real) surged by $110 billion during the quarter.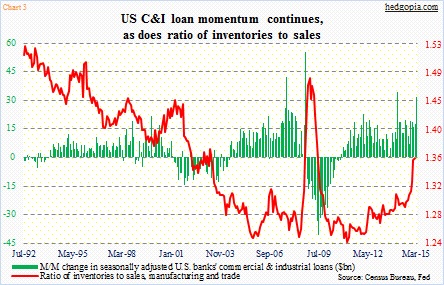
But the ISM report, from the standpoint of inventories, and the factory report, from the perspective of orders, are pointing to a good direction. Fingers crossed.
Thanks for taking the time to read this post!
