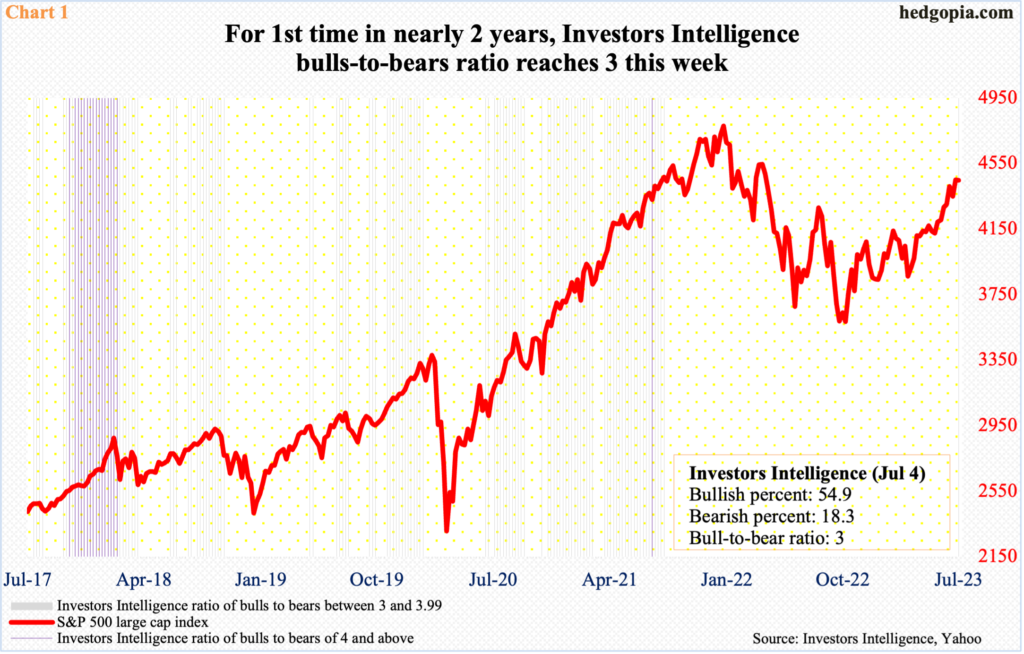
The ratio of Investors Intelligence bulls to bears hit three this week. This is not as extreme as four, or higher, but in today’s market, even three is becoming rare. This takes place even as the S&P 500 just hit channel resistance.

The Investors Intelligence bullish percent jumped 4.9 percentage points week-over-week to 54.9 percent this week. This was the highest reading since November 2021 and the fifth week in a row bulls’ count stayed north of 50 percent. Bears, in the meantime, slid three-tenths of a percentage point to 18.3 percent, which has not been this low in nearly two years – since August 2021, to be precise.
In the week to October 11 last year, as the S&P 500 was bottoming, bulls and bears hit 25 percent and 44.1 percent respectively, which was the lowest and highest since February 2016 and October 2011, in that order. The massive surge in bearishness last October laid the foundation for the rally that ensued. Through last Friday’s intraday high of 4458, the large cap index has gone up 27.7 percent. Wednesday, it closed at 4447.
Since last October, sentiment has now done a 360 – pretty much. In fact, the ratio of bulls to bears hit three this week. This is the first time in nearly two years the ratio reached that threshold (Chart 1). During this period, the S&P 500 peaked in January last year and dropped 27.5 percent through the October low. It then took more than eight months of persistent strength in stocks for the ratio to hit this high. Bulls can argue it has not hit four yet, which is true. The last time the ratio reached four was a couple of years ago, and on a sustained basis was the latter months of 2017 and early 2018. Four is rare. Even three is becoming rare, as this week’s is the first in nearly two years.

This is taking place at a time when the S&P 500 has reached a crucial technical juncture.
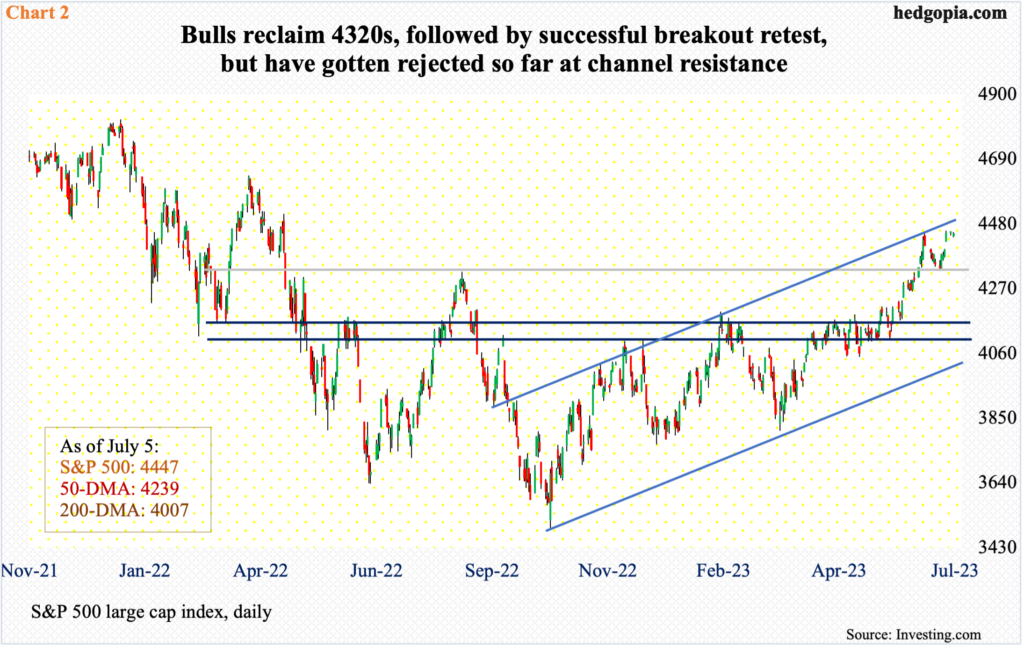
On Monday last week, the large cap index defended breakout retest at 4320s. This price point has memory attached to it. Last August, a countertrend rally stopped at 4325, before falling all the way to October’s low of 3492. On June 12 (this year), the August high was reclaimed, followed by a high of 4448 on the 16th and then a 2.7-percent decline before attracting bids at 4320s early last week.
The high on the 16th came about at the upper bound of an ascending channel from last October’s low. After a brief decline and a successful retest at 4320s, the S&P 500 rallied 2.4 percent last week to once again test the channel resistance (Chart 2). This is a spot where offers can potentially overwhelm bids – particularly when sentiment is as elevated as it is. Thus far, bulls are on the defensive; this should continue to be the case in the weeks ahead.
Thanks for reading!

