
What if?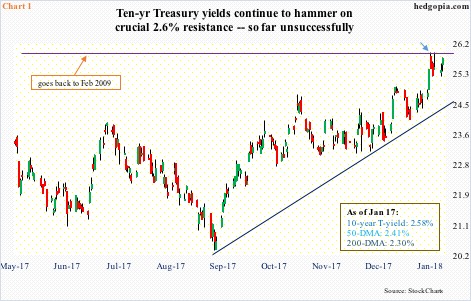
What if China proceeds to reduce its purchases of Treasury securities? At $1.18 trillion, it is the largest holder. Japan – at $1.08 trillion – is close second.
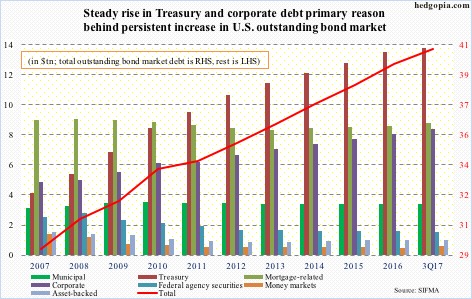
The U.S. Treasury market is $14.2-trillion strong (chart here).
On Wednesday last week, Bloomberg carried an article – entitled ‘China Weighs Slowing or Halting Purchases of U.S. Treasuries’ – arguing that exact point. Ten-year Treasury yields rallied intraday to 2.6 percent in that session, but was not able to punch through that resistance (blue arrow in Chart 1).
The Bloomberg story came even as investors/traders of late have been wondering if the three-decade-old bull market in U.S. bonds has come to an end. If China is indeed considering lightening up on Treasury purchases, that in due course does not help the bullish case.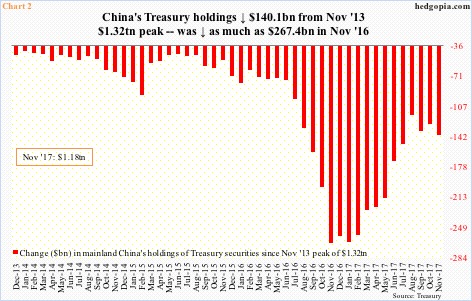
The thing is, China, which uses Treasurys to recycle its trade surplus with the U.S., has been reducing its holdings for a while now – gradually, of course. Holdings peaked in November 2013 at $1.32 trillion, and bottomed at $1.05 trillion in November 2016.
The trend is down if we focus on the peak four years ago, but up from a year ago. In 2017 through November, China added $118 billion to its holdings. The bars in Chart 2 have been shrinking since November 2016.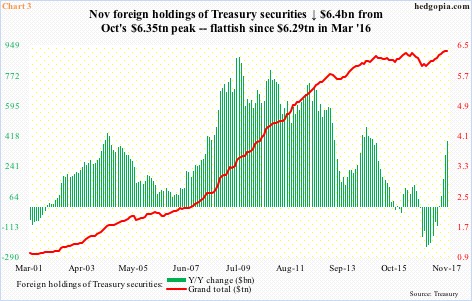
Overall, in the first 11 months last year, foreign holdings of Treasury securities went up $336.8 billion to $6.34 trillion. This was down slightly from the record high $6.35 trillion in October. So the trend is still positive.
In Chart 3, the red line has risen since bottoming at $5.95 trillion in January last year. That said, the prior peak was reached in March 2016 at $6.29 trillion. Hence, going back nearly two years there is a flattish look to it.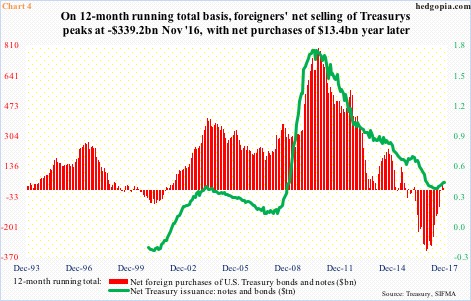
This is a potential problem down the line.
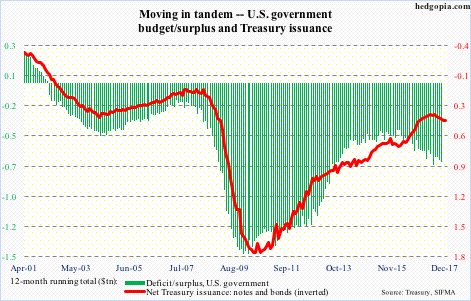
Here and now, the green line and the red bars in Chart 4 still move hand in hand. The former is a 12-month running total of the Treasury’s issuance of notes and bonds, and the latter foreigners’ purchases of these securities.
In November 2016, foreigners were net-selling $339.2 billion. One year later, they net-purchased $13.4 billion worth.
The chart also shows that issuance has gone up – from $335.1 billion last July to $399 billion last month. Risk/reward odds favor the trend will persist.
The U.S. economy is in its ninth year of recovery. Throughout this, on a 12-month rolling total basis, the government never ran a budget surplus.
Back in June 2010, the deficit peaked at $1.7 trillion, before coming under sustained pressure. Since $335 billion last July, however, the deficit has once again been rising, with December at $399 billion (chart here).
Tax cuts have just been passed. In all probability, this is not going to improve the budget situation, which means more Treasury issuance.
The question then is, what if the red bars in Chart 4 fail to move up to meet with the green line that is almost certain to come under upward pressure in years to come? What if?
Thanks for reading!
