
U.S. 10-year Treasury yields peaked in September 1981 at 15.8 percent, then dropped all the way to bottom at 1.34 percent in July 2016. Some bull market in bonds!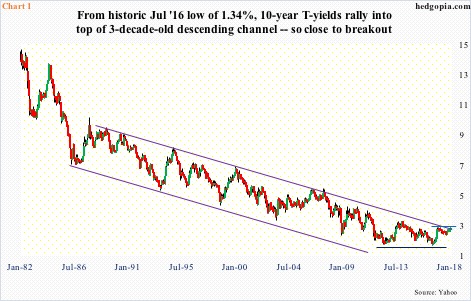
On an absolute basis, the 10-year is still trapped in a three-decade-old descending channel (Chart 1). It is doing its best to break out, but so far the upper end of the channel is holding firm.
That said, on an intraday basis last Tuesday, a breakout already occurred – albeit meekly – rising to 2.6 percent, before ending the week at 2.55 percent.
A convincing breakout has the potential to reverberate through all sorts of assets, across geographies.
Bill Gross, of Janus Henderson, says a bear market has been confirmed in U.S. bonds. He is already short.
It is too soon to say if this is a widely held opinion among market participants. Heavy bearish institutional footprints are lacking – at least now.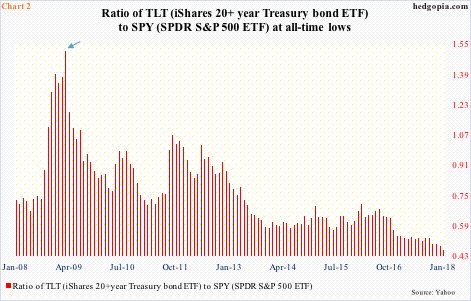
In the event the majority decides a bear market in bonds has begun, one can just imagine what Chart 2 would begin to look like. This, of course, assumes that in a portfolio reallocation, stocks inordinately benefit from bond outflows.
As mentioned above, 10-year yields, on an absolute basis, persistently went lower for 35 years until they bottomed in July 2016. Bonds rallied vigorously. Although on a relative basis versus stocks, they started going down nearly nine years ago.
U.S. stocks reached a major bottom in March 2009. That is when the ratio between TLT (iShares 20+year Treasury bond ETF) and SPY (SPDR S&P 500 ETF) in Chart 2 peaked. Last week, it reached an all-time intraday low of .441, closing at .448.
Put another way, since March 2009, stocks have risen much faster than bonds, even though 10-year yields are still trapped in that channel.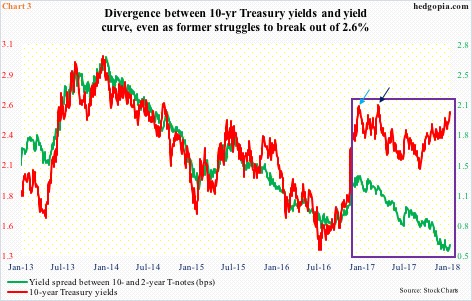
It is important to remember that because it is a descending channel, the level where a breakout occurs constantly declines. It currently lies around 2.5 percent. A couple of months later, it will be lower. In essence, as time passes, a breakout is bound to happen – sooner or later.
The bigger question is, what would the masses consider as a breakout? Or institutions, for that matter.
In this context, 2.6 percent is a level to watch.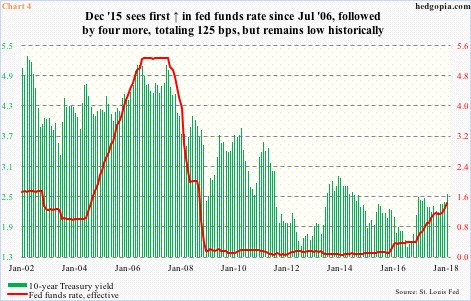
Back in December 2016, the Fed raised the fed funds rate by 25 basis points to a range of 1/2 to 3/4 percent – its second hike since December 2015 (Chart 4). Ten-year yields rallied vigorously into this, and stopped on a dime after hitting 2.62 percent (blue arrow in Chart 3). Then in March 2017, when the fed funds rate was raised by another 25 basis points to 3/4 to one percent, 2.62 percent was tested again (dark blue arrow) – once again unsuccessfully.
Last week, bond bears tried to take out that resistance twice, and came up short on both occasions.
The question is, should a breakout occur, could this put upward pressure on the yield curve (10s/2s)?
One of the enigmas in the bond market is the persistent downward pressure the spread between 10- and two-year yields has come under, even as the fed funds rate has gone up by 125 basis points since that December 2015 hike.
In Chart 3, for a year now, a clear divergence between 10-year yields and the yield curve has developed. It is almost as if markets are not convinced the rally in these yields are sustainable. In this scenario, resistance at 2.6 percent holds – duration notwithstanding – which also means this is an opportunity to buy bonds. Picture changes if 2.6 percent gives way.
Thanks for reading!
