
Last Friday’s sudden selloff in equities speaks of heightened investor nerves. Amidst this, NVDA, the poster child of the AI revolution and the associated tech rally, reports this Wednesday; ahead of this, there are subtle signs of distribution. An adverse reaction to its results will reverberate through the stock market.

Until last Thursday’s close, the S&P 500 was up 0.05 percent for the week – on the way to reversing a back-to-back weekly decline of the prior two weeks. As a matter of fact, the large cap index had reached a fresh all-time high of 6147 on Wednesday.
In the week before, it looked like the index was well positioned for a breakout, closing at 6115, with an intra-week high of 6127, which was less than a point from 6128 posted on January 24. The breakout did occur, but momentum soon ran out of steam (Chart 1).
Come Friday, weaker-than-expected consumer sentiment and some macro data led sellers to come out of the woodwork. The S&P 500 was slammed for a 1.7 percent decline, closing the week at 6013, essentially right on the 50-day at 6010. There is also horizontal support at 6000. The average is no longer rising. It is flattish at best. A likely breach ahead opens the door toward 5870s, followed by 5770s, with the latter also being the low of last month. The 200-day – still rising – rests at 5702.
Friday’s sellers could be vindicated if Nvidia’s (NVDA) results draw an adverse reaction. The $3.3-trillion company – second only to Apple’s (AAPL) leading $3.7-trillion market cap – reports its January quarter on Wednesday.
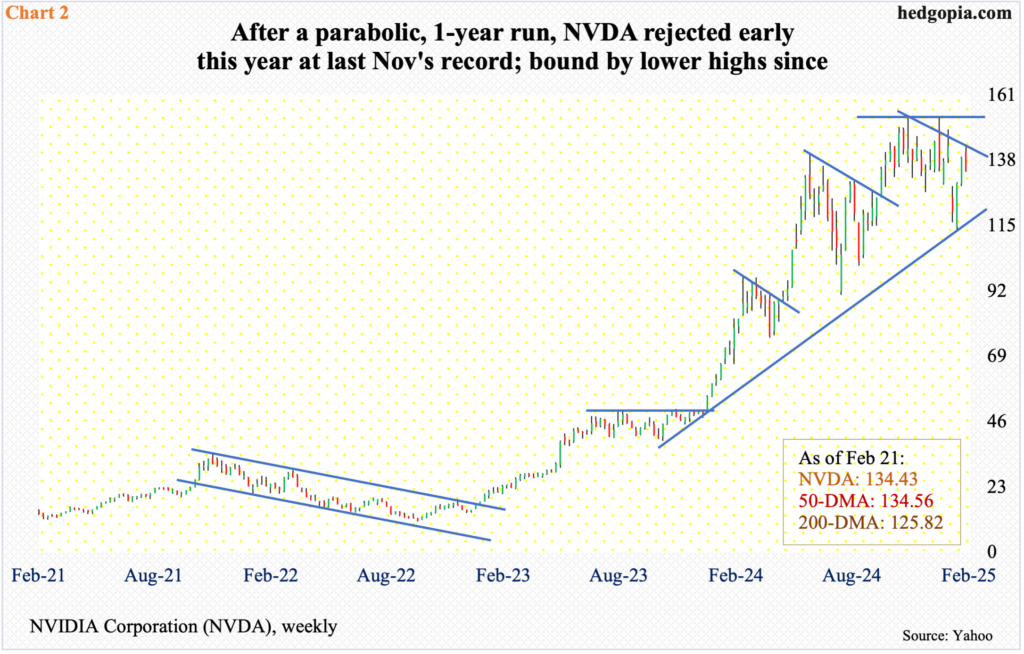
NVDA is expected to bring home $0.85 in earnings per share, with the estimates remaining unchanged for at least the past three months. Its shares peaked three months ago at $152.88 on November 21. That high was unsuccessfully tested with a fresh high of $153.13 on January 7, with a massive reversal ending the session at $140.14. The subsequent selloff ended on the 3rd this month with a low of $113.01. Last Tuesday, the stock ticked $143.44 but finished the week lower 3.3 percent to $134.43. Tuesday’s high was rejected at a falling trendline from last November’s high (Chart 2).
This is taking place at a time when the 50-day ($134.56), which went sideways for five weeks before trending lower, seems to want to drop toward the 200-day at $125.82.
For the bulls, even if Wednesday’s results are received well, and the stock rallies, $153 likely offers strong resistance, as those that did not sell previously treat this as an opportunity to unload.
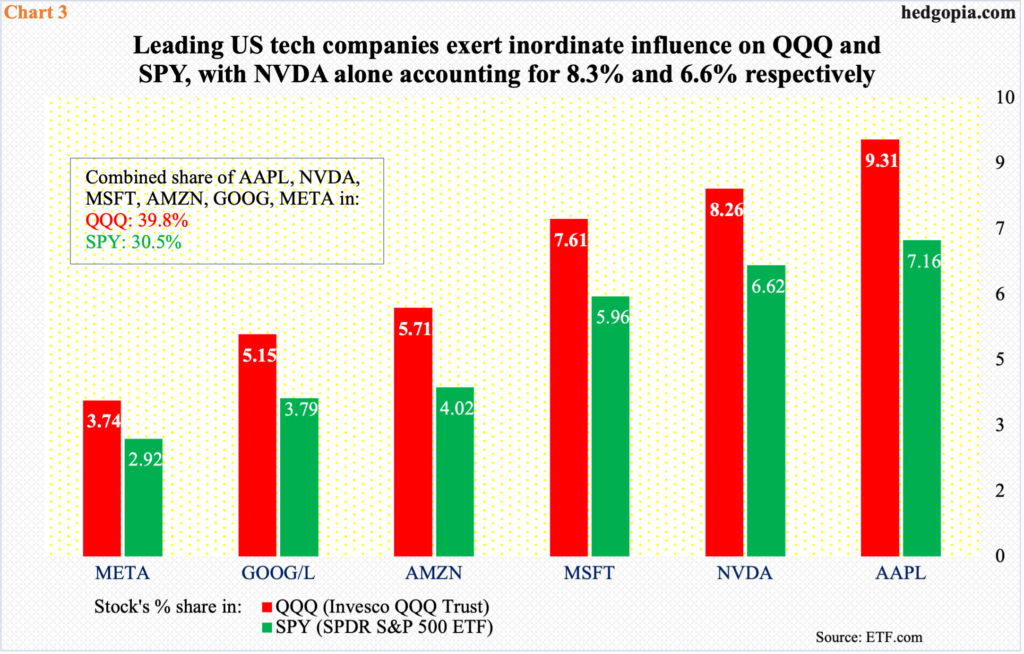
This will have repercussions for market-cap-weighted indices particularly. Tech’s role in the stock market needs no elaboration. The leading top six companies – all tech – wield such a lopsided influence on QQQ (Invesco QQQ Trust) and SPY (SPDR S&P 500 ETF), with weights of 39.8 percent and 30.4 percent, in that order. NVDA alone accounts for 8.3 percent and 6.6 percent of the ETFs, second only to AAPL’s (Chart 3).
Besides, NVDA has been treated as a giant play on the artificial intelligence (AI) revolution. If it sneezes, other AI plays such as Microsoft (MSFT), Google parent Alphabet (GOOG) and Facebook parent Meta (META) are bound to catch a cold.
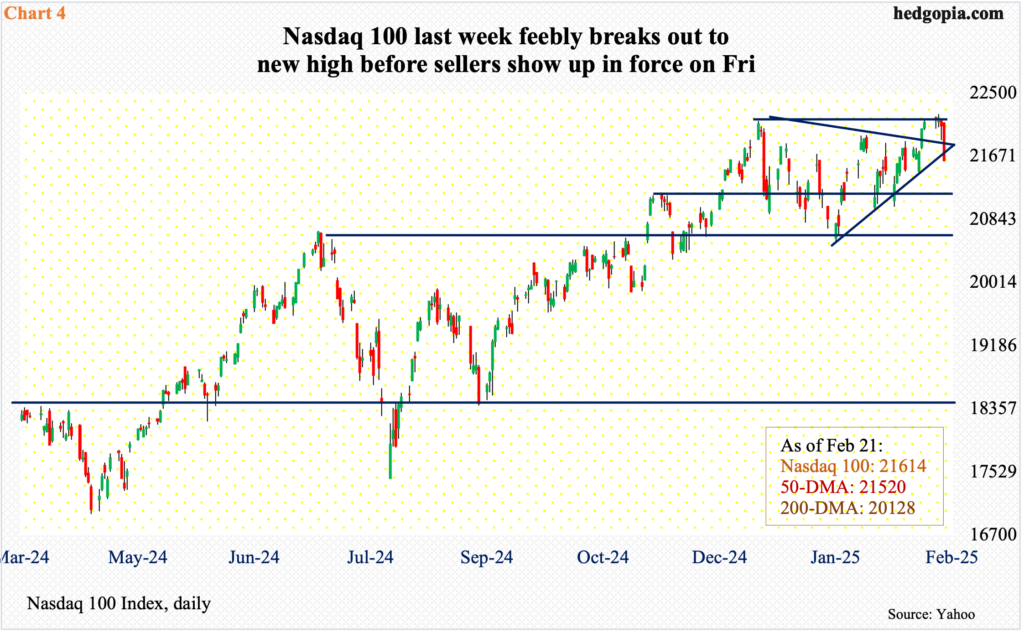
Leading into this, the Nasdaq 100 last Friday tumbled big. As was the case with the S&P 500, the Nasdaq 100 was on the verge of a breakout, which did materialize on Wednesday with a new intraday high of 22223 – past the prior high of 22133 from December 16 – but this proved fleeting. Thursday saw some downward pressure, while Friday was a 2.1-percent downer, finishing the week at 21614, just above the 50-day at 21520. Once the average gets compromised, with minor horizontal support at 21100s, there is no decent support until 20500s, which also approximates the January 13 low of 20538 (Chart 4). A rising trendline from that low was breached on Friday.
Last Friday, it seemed as if the longs were looking for reasons to sell. If NVDA’s results justify this precaution, then a decent selloff is the path of least resistance in the weeks ahead.
Thanks for reading!
