
The April 21st European Central Bank (ECB) governing council meeting was anti-climactic.
The deposit rate on lenders’ reserves parked at the central bank was maintained at minus 0.4 percent. As well, Mario Draghi, ECB president, continued his oft-repeated ‘all policy tools remain on the table’ assertion. Markets yawned.
Post-meeting on Thursday, the euro at one point was up 0.9 percent to 113.97 before giving back the gains and falling back to 112.86, down 0.1 percent for the session. Come Friday, it shed another 0.5 percent.
Since March 10th in particular, the euro has been marching to its own beat. On that day, the ECB delivered its ultra-dovish stimulus package, including QE expansion from €60-billion/month in purchases to €80 billion and purchases of corporate debt. The euro would instead end up 1.6 percent. Not what Mr. Draghi would have liked to see.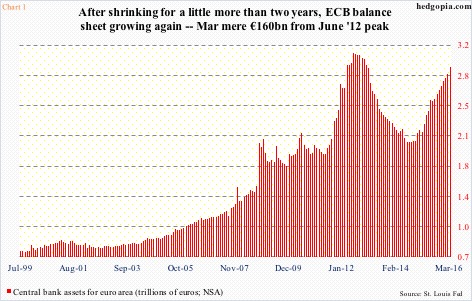
Longer-term, though, QE’s impact on the euro has been favorable. The ECB’s balance sheet began shrinking after peaking at €3.1 trillion in June 2012. It then bottomed at €2.04 trillion in September 2014, and has been rising since, with March at €2.94 trillion (Chart 1). The euro dropped from nearly 130 at QE introduction to just under 103 in March last year.
Subsequently, rallies have persistently stopped at 114-114.50. On FXE, the CurrencyShares euro ETF, the corresponding resistance lies at 111.50-112.
Most recently, after unsuccessfully trying to break out for three consecutive weeks, FXE once again had a feeble shot at that ceiling last week, but to no avail (Chart 2).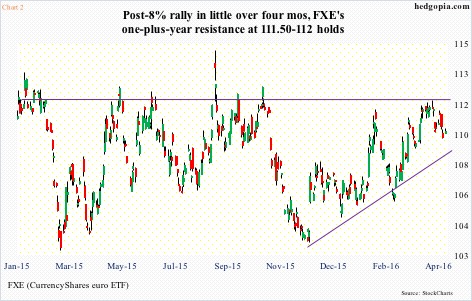
Weekly indicators have now rolled over, with room to continue to drop. The 50-day moving average (109.36) is flattening/dropping slightly. Incidentally, that is about where the November 2015 rising trend line draws to (Chart 2). Last Friday’s low on FXE bounced off the lower Bollinger Band.
This is taking place even as non-commercials’ net shorts in euro futures are at a multi-month low. April 19th holdings were 46,917 contracts, not too far away from 46,857 on February 23rd. The latter was the lowest since June 2014 (Chart 3). Since that low, net shorts rose all the way to 226,560 last March. Since then, the euro/FXE has gradually trended higher, although persistently repelled at the afore-mentioned ceiling.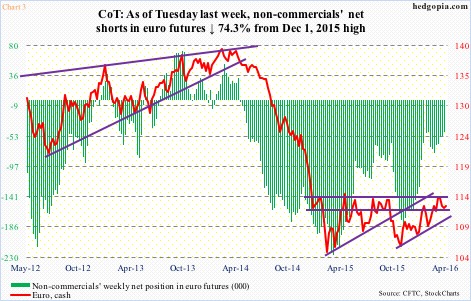
Given the shrinkage in non-commercials’ net shorts, this squeeze tailwind is running dry. That said, near-term, FXE is oversold on a daily chart. If it rallies, that probably would not last very long. The afore-mentioned resistance at 111.50-112 probably holds.
Shorts have a decision to make – whether to continue to hold or cover now and maybe short from a higher level or stay short but deploy options.
Hypothetically on April 13th, FXE (109.96) was shorted at 111.28. Rather than covering outright, in the current circumstances a covered put might be better.
April 29th weekly 111 puts fetch $1.50. A short put, if not assigned, raises the price FXE was shorted at to 112.78. If assigned, the position is liquidated for a profit of $1.78.
Thanks for reading!
