
 One consistent theme the last several weeks on this blog has been that of divergence. In a healthy market, things tend to – or are supposed to – move in unison. Simplistically, let us say a widget is in production. This creates business for a transport company, whose job it is to haul that item to an outlet where a consumer can come and purchase for consumption. The cycle is kept alive and well as long as the last link in the chain is healthy. A lack thereof gives birth to excess inventory, which helps reverse that virtuous cycle into a vicious one. That producer in question would now need to produce less and possibly have fewer people on the payroll. Ultimately, it has the potential to negatively impact consumer spending, which then will have repercussions for business capital spending. Here is the thing. In an economy – particularly at an inflection point – some sectors/industries lead, some lag, yet others are coincident. Those that lead tend to diverge from those that lag. Reason why technicians keep such a keen eye for ‘divergence’.
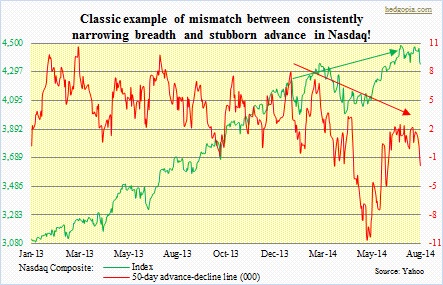
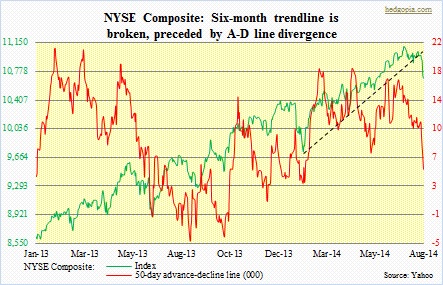 There have been plenty lately – ranging from small versus large-caps, consumer discretionary versus staples, regionals versus money-center banks, high-yield corporate bonds versus Treasury bonds, and what have you. In the past, we have carried a chart showing Nasdaq A-D line spanning 20 years. The chart above shows the same but over a much shorter horizon, so the recent divergence between the index and its 50-day A-D line can be properly seen. And it is crystal clear. Real deterioration took place mid-April when the A-D line nosedived from nearly 3k to north of -10k in a matter of month. As this was taking place, the index did not even drop 100 points. Capital was shifting into big-caps, and a select few were doing all the heavy-lifting. The soldiers were getting hurt. Now the generals are catching up. It is important to note that early March when the Nasdaq unraveled for a month-and-a-half, 10-percent decline, buyers showed up right on a trendline drawn from November 2012. That trendline currently stands at 4150. Given oversold technical conditions in the intermediate term, it is probable the index is headed there. From the recent high, we are only talking a seven-percent decline. Not a big deal, provided damage is contained there. There is a similar pattern developing on the NYSE Composite Index. As with the Nasdaq, the NYSE A-D line has not been cooperating with the advance in the index. Last week, a six-month trendline was broken. An October 2011 trendline currently extends to 10400, which is less than three percent away from the current level. That in all probability will be tested. Bulls better step up to defend that.
