
The 3Q18 earnings season begins in earnest next week. Small-caps have sold off big into this (more on this here), but not large-caps. The Dow Industrials Wednesday rose to a fresh high, although the session produced a candle with a long upper shadow. The S&P 500 large cap index (2925.51) is merely 0.5 percent from its all-time high reached on September 21, and the Nasdaq 100 index (7637.43) 0.8 percent from a record set this Monday.
These indices are holding their ground primarily because of the generals. The soldiers are not taking part.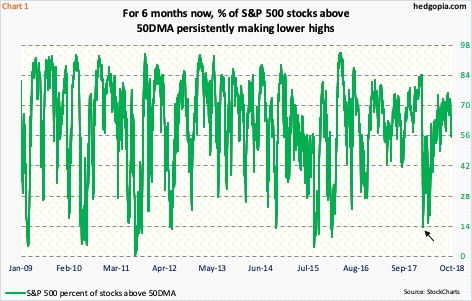
Take the S&P 500. Wednesday, only 55.2 percent of stocks were above their 50-day moving average (Chart 1). This was the lowest in three months. During this, the index broke out of 2800 mid-July, before rallying to newer highs. The generals did all the heavy lifting, while the soldiers kept losing ground.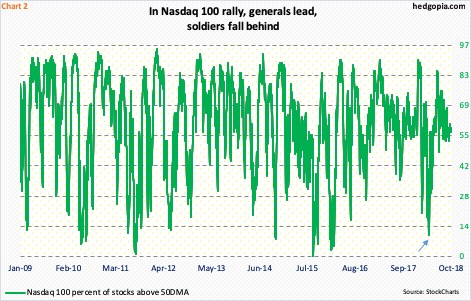
On the Nasdaq 100, same dynamics are in play. Wednesday, 59 percent of stocks were above their 50-day. Once again, the index is a stone’s throw away from a new high. On the Nasdaq composite, the same metric lies at 41.9 percent (not shown here). The latter is much broader, encompassing over 3,400 companies. The Nasdaq 100 obviously includes 100 largest US and foreign non-financial companies listed on the Nasdaq. It is market cap-weighted, as is the S&P 500.
The thing is, the green lines in both Charts 1 and 2 can go a lot lower. When stocks bottomed early February, they respectively bottomed at 13.6 percent (arrow in Chart 1) and 20 percent. In fact, on the Nasdaq 100, the metric proceeded to bottom at 10 percent early April (arrow in Chart 2). This is a worst-case scenario for the bulls, in which the generals will soon begin to catch up with the soldiers.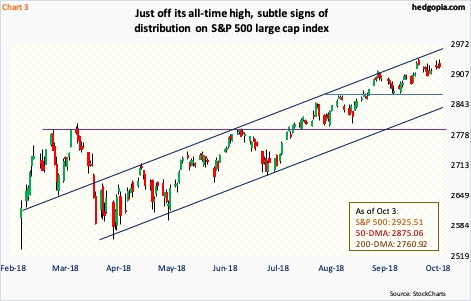
There are some signs of distribution on these indices.
For six consecutive sessions now, bulls tried to rally the S&P 500 intraday but in the end were unable to hang on to all of the gains. Monday was a spinning top and Tuesday a doji. The index is still above shorter-term moving averages, which are being tested. The weekly in particular is way overbought. The start of unwinding of these conditions means the green line in Chart 1 continues lower.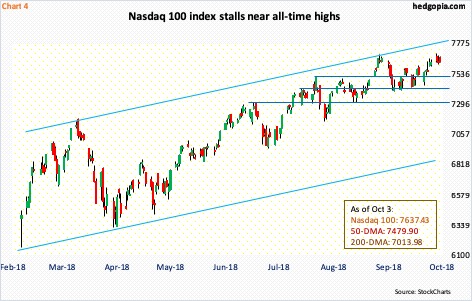
Over on the Nasdaq 100, bulls defended the 50-day for 13 sessions last month, before lifting off of it. But unlike in the past the liftoff has been anything but impressive. Monday’s intraday high edged past the prior high from August 30, but only to stall.
Amidst all this, it is not inconceivable that both these indices manage to break out of their current congestion, particularly if nearest support levels are defended in a selloff. This is because the soldiers are extended to the downside. The percent of S&P 500 and Nasdaq composite stocks above their 50-day are in oversold territory. This metric can easily turn back up and unwind their respective conditions. In this scenario, the generals likely get a tailwind, resulting in breakout from short-term consolidation. This may be fine near term, but not medium- to long-term, as the generals continue to remain extended, and that is not healthy.
Thanks for reading!
