
IWM is breaking down, losing one after another support. Amidst this, the daily is grossly oversold. A bounce can happen – or not. This perhaps creates an opportunity for a non-directional trade involving options.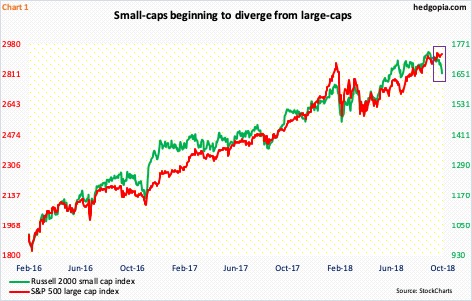
Small-caps are taking it on the chin. Hard. Large-caps are holding their own. Historically, they tend to move in tandem. The divergence between the Russell 2000 small cap index and the S&P 500 large cap index is not that wide (box in Chart 1), but the ratio between the two has come under pressure since August 22 from 0.602. Tuesday was 0.567.
The Russell 2000 peaked on August 31 at 1742.09, and has shed 4.5 percent since. The S&P 500 reached its all-time high of 2940.91 on September 21 and is only down 0.6 percent from that peak.
The S&P 500 has not followed the Russell 2000 lower, but is giving out signs of fatigue. Monday and Tuesday were doji sessions, with the three sessions prior to that producing candles with upper shadows. The way small-caps are breaking down, it is increasingly difficult for large-caps to remain unscathed for too long.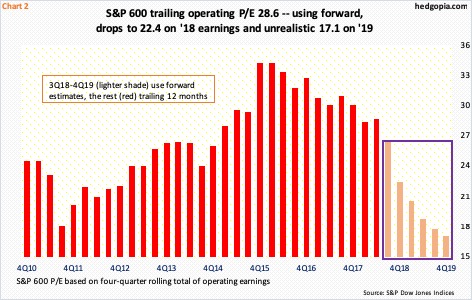
As far as small-caps are concerned, they are catching up to persistent downward revision in earnings estimates. Operating earnings estimates for S&P 600 companies for 2018 peaked at $50.66 as early as March. As of the end of September, they were $46.27. For 2019, estimates peaked at $61.63 at the end of June; three months later, they were $60.71 Recall that the sell-side aggressively raised estimates in the wake of last December’s corporate tax cuts. The Tax Cuts and Jobs Act of 2017 was passed into law on December 22. A day prior, 2018 estimates were $45.41, meaning the upward revision post-tax cuts has essentially been revised away.
This obviously has repercussions for valuations. Chart 2 plots the P/E ratio for the S&P 600 small cap index. On a trailing four-quarter basis, it traded at an elevated 28.6x in 2Q18. The multiple progressively drops on forward estimates. But how reliable are these estimates given the revision trend? Probably not a whole lot, particularly 2019 estimates.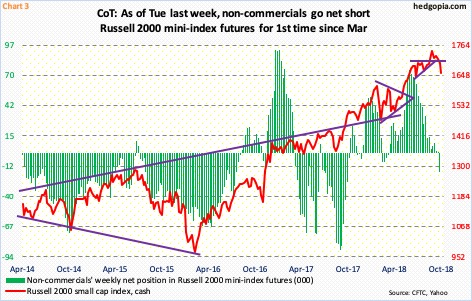
Kudos to non-commercials who probably saw this coming and began to play cautious much earlier. At the end of May, they held 74,239 net longs in Russell 2000 mini-index futures. Then they began to cut back. Tuesday last week, they were net short 17,939 contracts. This was the first time they went net short since early March. They have been rewarded.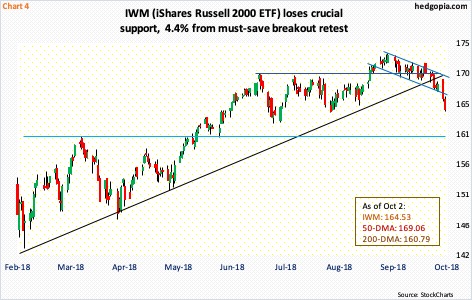
Last week, IWM (iShares Russell 2000 small cap index) fell 1.1 percent. By Tuesday this week, it was already down 2.4 percent. In the process, it has lost support left and right, including a rising trend line from February. Turns out the August breakout was false. The ETF is now well below the breakout point. The 50-day moving average is gone as well.
Mid-May, IWM had a major breakout – out of $160-plus (Chart 4). It is 4.4 percent from breakout retest. Should a retest take place, the ETF ($164.53) would have slightly lost the 200-day ($160.79). In all probability, a retest is coming – timing notwithstanding.
The daily is grossly oversold. A bounce can happen anytime – or not. In a time like this, options can help.
IWM long Oct 19 iron butterfly:
- Long 169 call at $0.49
- Short 164.50 call at $2.24
- Short 164.50 put at $1.98
- Long 160 put at $0.76
Hypothetically, a long iron butterfly expiring October 19 (13 sessions remaining) earns a credit of $2.97. Wings are $4.50 wide; $1.53 is at risk. Breakeven is at $167.47 on the up and $161.53 on the down.
Thanks for reading!
