
The fed funds rate has gone up more than 450 basis points since last March, and more tightening is on the way. This is yet to sufficiently make a serious dent in consumer inflation, even as economic data particularly surrounding jobs have strengthened. The Fed has no choice than to engineer an economic contraction.
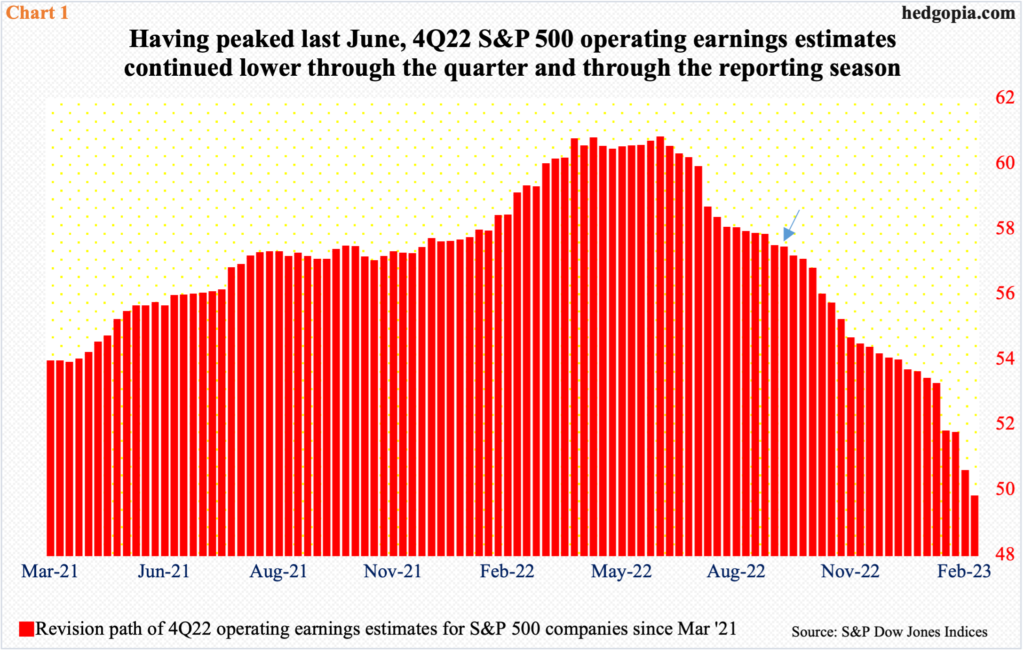
With 84 percent of S&P 500 companies having reported 4Q operating earnings, the revision trend continues to disappoint. As of last Tuesday, blended earnings were $49.73, down significantly from the $60.74 high from last June. That was a while ago. When 4Q began, which was less than five months ago, sell-side analysts were expecting these companies to ring up $57.37 (arrow in Chart 1); when the quarter ended, estimates were $53.54 – meaning these analysts continued to cut all through the reporting season.
At the current trajectory, 4Q will be the third quarter in a row earnings will have declined year-over-year. This is expected to reverse in the current quarter, with the momentum expected for the rest of the year. For 2023, earnings are expected to come in at $220.16, up 12.1 percent from last year’s $196.31 consensus. In 2022, earnings fell 5.7 percent.
The expected jump in earnings growth this year is hard pill to swallow. The sell-side has essentially penciled in an economic soft-landing. But the Federal Reserve, with a focus on inflation, increasingly has no choice than to drive the economy into significant deceleration at best and recession at worst.
As things stand, despite the ongoing monetary tightening, the economy continues to churn out good numbers.
Jobs are plentiful. January produced 517,000 non-farm jobs, and weekly unemployment claims hover around 200,000. Real GDP last quarter grew at an annual rate of 2.9 percent, with 3Q growing 3.2 percent.
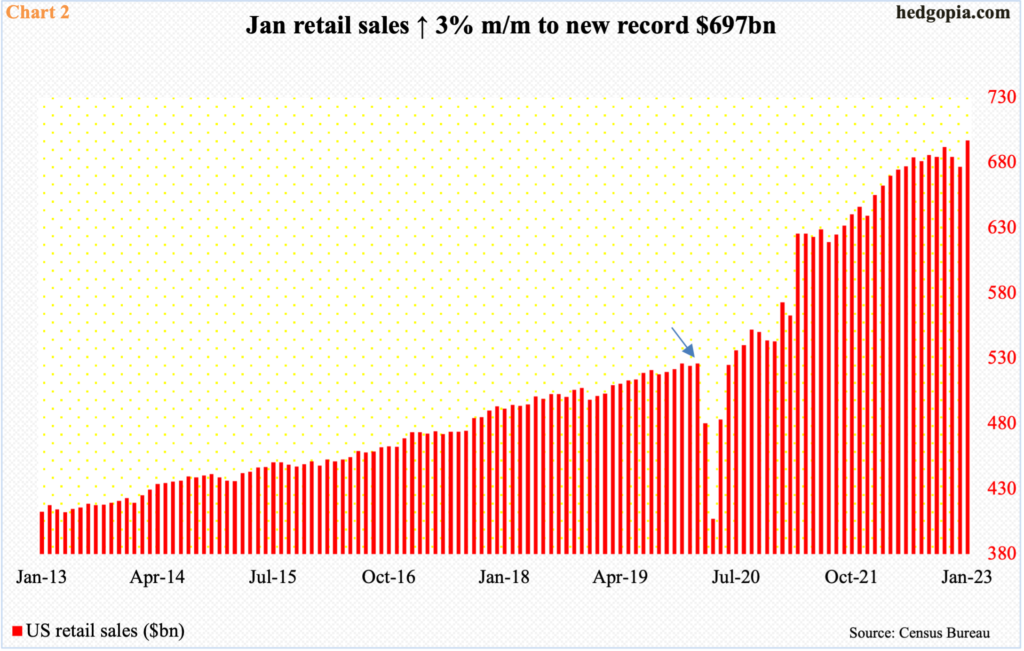
For the most part, consumer spending is holding up. In January, retail sales jumped three percent month-over-month to a seasonally adjusted annual rate of $697 billion – a fresh record and much higher than the pre-pandemic high of $526.2 billion from February 2020 (arrow in Chart 2).
Consumers are dipping into the excess savings stemming from Covid stimulus – both fiscal and monetary. At some point, they will no longer remain a force.
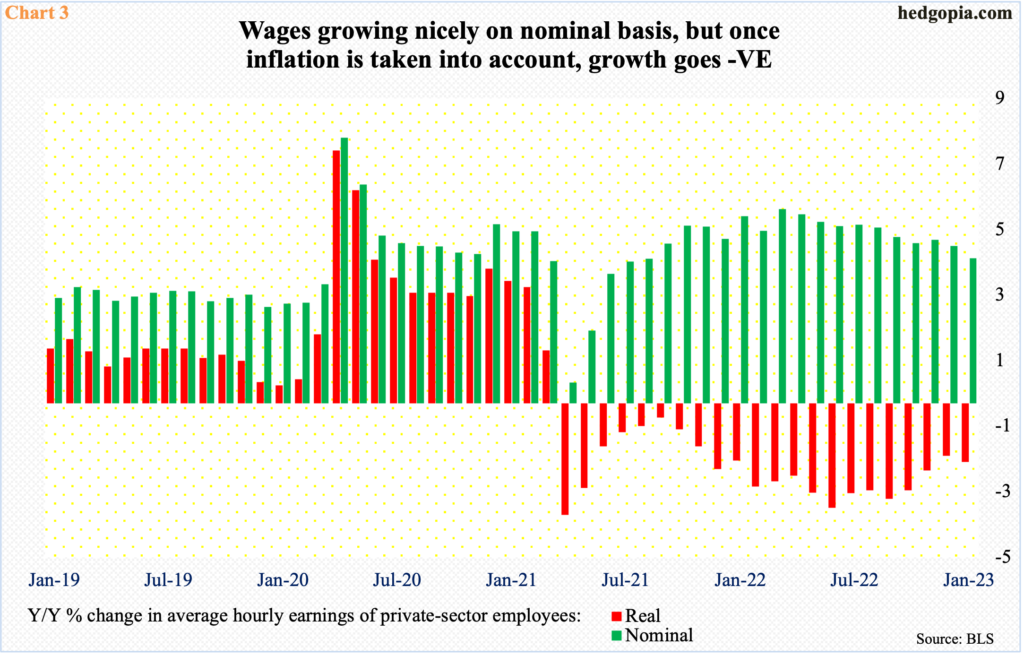
Currently, worker wages are growing at a decent pace. In January, private-sector average hourly earnings increased 4.4 percent year-over-year to $33.03. That said, on a real basis, earnings fell 1.8 percent to $10.99. The negative growth in real earnings is not just a recent phenomenon. This has been going on uninterrupted since April 2021 (Chart 3).
Inflation makes all the difference.
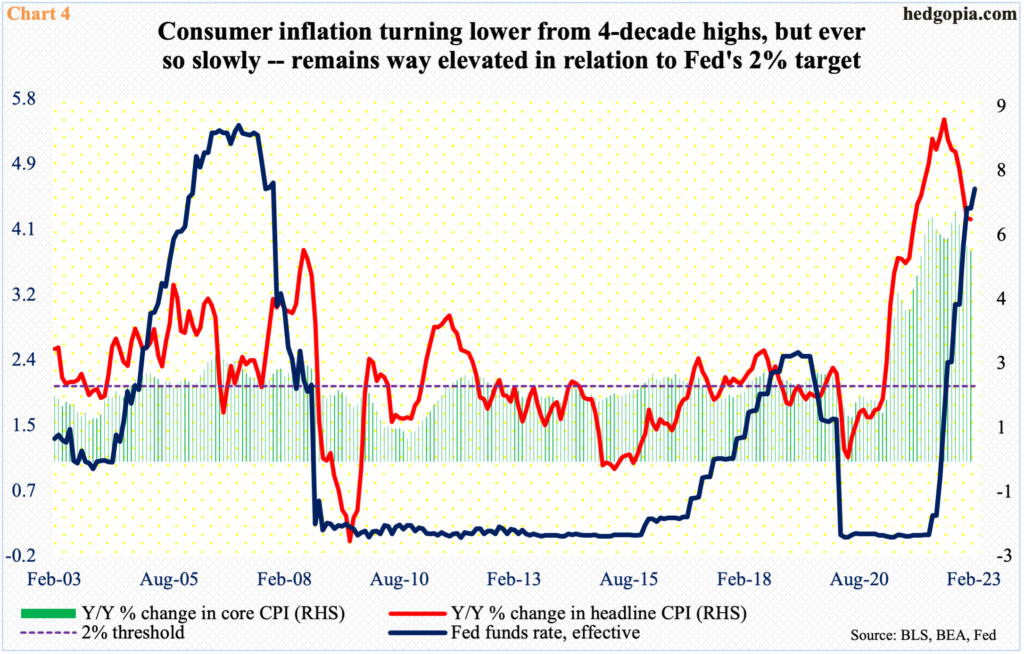
Consumer inflation has steadily trended lower from last year’s four-decade highs but remains elevated.
In the 12 months to January, headline and core CPI (consumer price index) grew 6.4 percent and 5.6 percent respectively (Chart 4), having peaked at 9.1 percent and 6.6 percent in June and September, in that order. At the time, they were the highest since November 1981 and August 1982.
The drop in both metrics in recent months puts inflation on the right trajectory, but the job is far from done. The Fed targets two percent on core PCE (personal consumption expenditures), which in December grew 4.4 percent year-over-year.
The benchmark rates remain below even if we consider core inflation that is in mid-single digits. The idea that the central bank will tolerate this the longer this gap persists makes zero sense. Chairman Jerome Powell has his credibility at stake. In this context, he would prefer he is remembered as Paul Volcker than George William Miller.
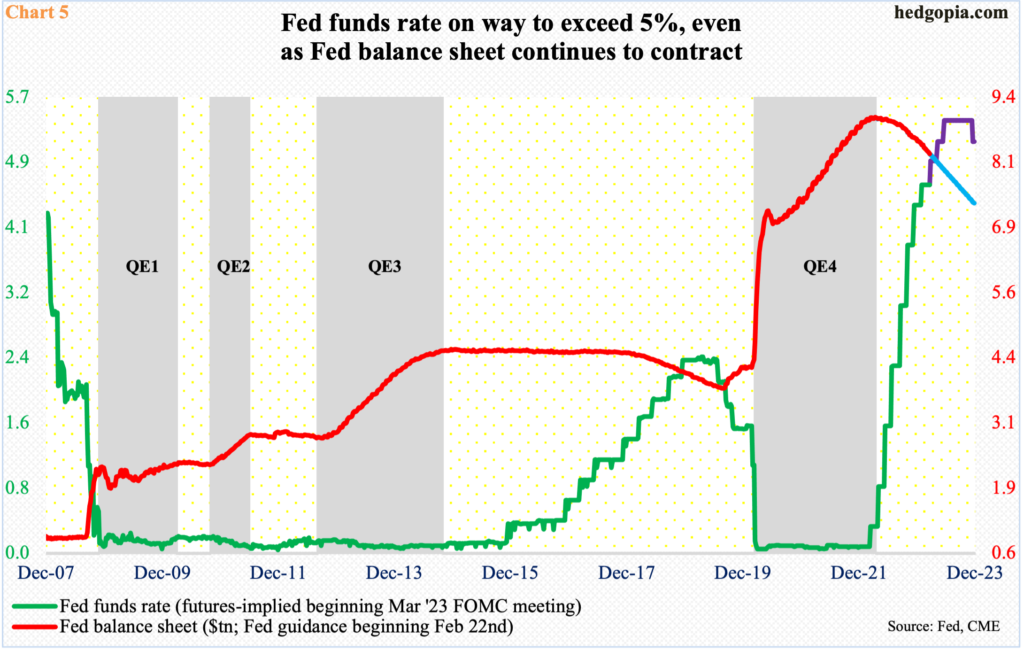
Markets are beginning to sense this but perhaps not enough. With the 25-basis-point hike early this month, the fed funds rate currently stands at a range of 450 basis points to 475 basis points. In the futures market, traders are currently pricing in three more 25-basis-point increases – one each in March, May and June – before the Fed stops at a range of 525 basis points and 550 basis points (Chart 5).
Here is the thing. First, until not too long ago, these traders expected the Fed to stop the tightening cycle just south of five percent. (The Fed is also withdrawing liquidity using the balance sheet, which is shrinking, albeit from a very high level.) The strength in economic data in recent weeks has forced them to revise their rates outlook to the upside. Second, they continue to expect the Fed to begin to ease later this year. Once again, odds favor they will be wrong on this.
The longer inflation proves sticky and the longer consumers hang in there, the Fed will feel the urgency to put a brake on growth.
In this scenario, 2023 earnings estimates carry plenty of downside risk. It is just a matter of time growth slowdown – Fed-engineered or not – will feed through to earnings. Stocks probably do not reflect this.
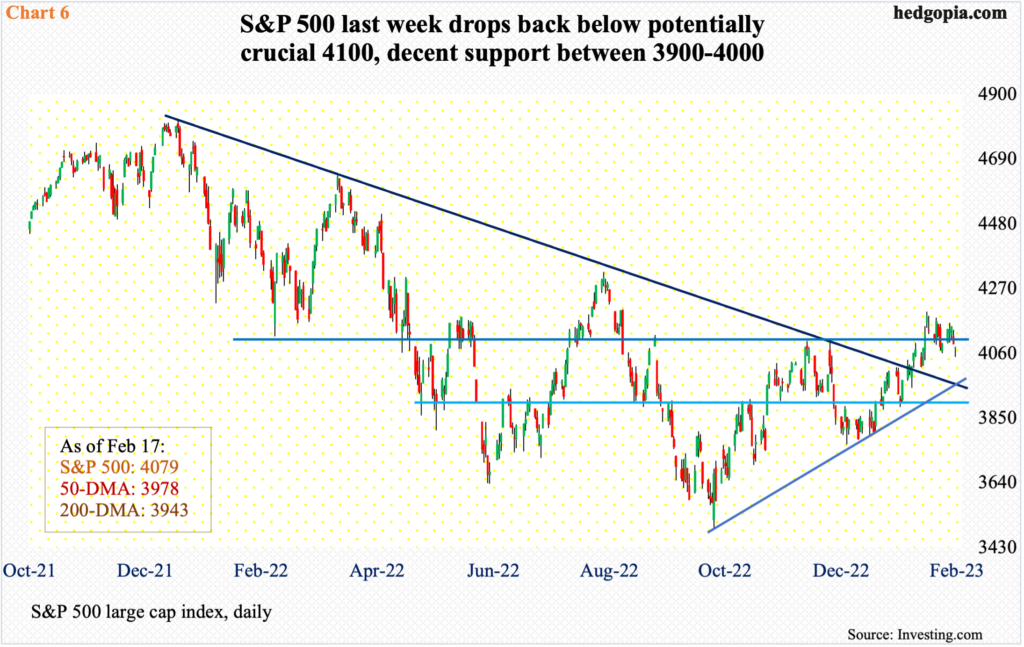
In fact, using the S&P 500, the large cap index rallied 20.2 percent intraday from its low of last October through the high early this month, before it came under pressure; through last Friday’s close, it is still up 16.8 percent from last year’s low.
If the weekly prevails, the index can continue lower. On its way to the February 2nd high, the S&P 500 broke out of 4100 in that very session, and the bulls were unable to hang on to it. The index breached 4100 last week, closing at 4079.
In the sessions ahead, 3950s is worth watching. This represents trendline support from last October’s low (Chart 6). Right around there lies horizontal support at 3900, as well as the 50- and 200-day moving averages (3978 and 3943 respectively).
Thanks for reading!
