
It is increasingly getting difficult to discern if US markets are in risk-on or risk-off mode. There is a bid under the long end of the sovereign bond market. This in general is a risk-off behavior. Both the S&P 500 large cap index and the Dow Industrials are under their respective late-January highs. The reverse is true if we look at how small-caps and tech have acted in recent weeks/months. They are both considered risk-on, and, unlike large-caps, proceeded to take out their late-January highs. Concurrently, high-yield corporate bonds – another metric used to take the pulse of risk-on sentiment, or a lack thereof – struggle.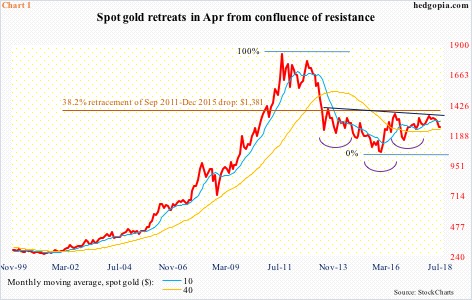
Gold, which traditionally gets bid up during times of stress, gets no love either. If the prevailing trade tensions between the US and China in particular qualify as uncertain times, then the yellow metal arguably has lost its safe-haven status. Or, it may simply be that markets currently do not believe we are in the early innings of a full-fledged trade war. Either way, gold has been in distribution for a while now.
The yellow metal peaked at $1,923.70/ounce in September 2011. Subsequently, it bottomed at $1045.40 in December 2015. It has since trended higher. But breaking through $1,360-70 has proven tough. This resistance goes back to October 2010, and most recently to June 2016. This level – $1,380.91 to be precise – also offers Fibonacci resistance, with 38.2-percent retracement of the September 2011-December 2015 decline lying there. This is also where the neckline of an inverse head-and-shoulders formation lies (Chart 1). In other words, a confluence of resistance lies there.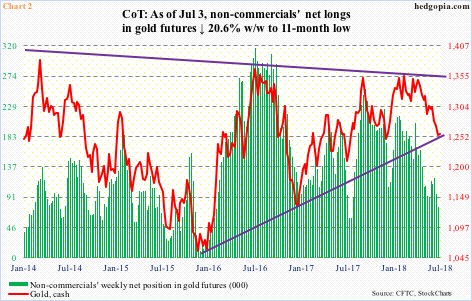
The last time gold bugs tested $1,360-70 was in April this year. Since then, it has been nothing but downhill, losing not only the 50- and 200-day moving averages but also $1,300. A rising trend line from December 2016 was lost in the process. Then came last week’s defense of a similar trend line from the aforementioned December 2015 low (Chart 2). Gold dropped to $1,238.80 last Tuesday and closed out the week at $1,255.80.
The April peak in gold was accompanied by flows out of gold-focused ETFs as well as non-commercials cutting back net longs in gold futures. In the week ended April 17, these traders were net long 163,069 contracts. By July 3, holdings had shrunk to 76,672 contracts, an 11-month low. Similarly, since April 11 through last Thursday, IAU (iShares gold trust) lost $484 million and GLD (SPDR gold ETF) $2.3 billion (courtesy of ETF.com). As of last Friday, GLD had $32.4 billion in assets, so these are sizable outflows. Near panic level? Too soon to say.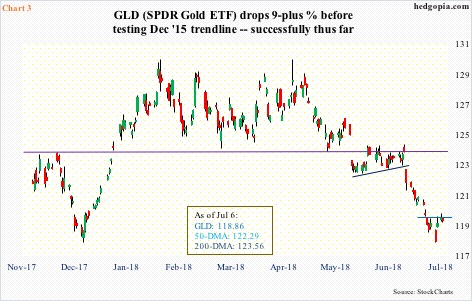
Hence the significance of the December 2015 trend line. If a serious breach occurs, stops likely get taken out, putting the metal under more pressure. Continued defense of this support raises the odds of improvement in flows. Non-commercials in particular tend to be trend followers. If a trend reversal has occurred in the metal, they will join in.
In this respect, last Monday’s intraday low of $117.40 on GLD ($118.86) is worth watching. Shorter-term moving averages are still dropping. Back-and-forth action is possible near term. Nearest resistance lies at $119, with tons of room to rally on the weekly chart.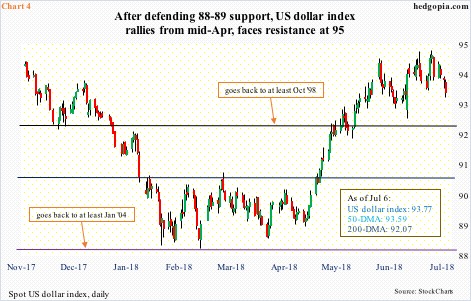
The US dollar index can lend a helping hand.
The index (93.77) is at an interesting juncture. The peak in January last year coincided with a 61.8-percent retracement of the 41.2–percent decline between July 2001 and April 2008. The past five weeks, it has essentially gone sideways, facing stiff resistance at 95, which approximates a 38.2-percent retracement of the 15.1-percent decline between January last year and February this year (more here).
On the daily chart, there is room for the US dollar index to go lower. Ditto with the weekly chart. A weaker dollar can provide a tailwind to the metal. As long as the December 2015 trend line is not broken, gold stands to regain lost luster.
In this scenario, hypothetically, a credit put spread on GLD can help.
August 10 GLD bull put spread:
- Short 119 at $1.33
- Long 117.50 at $0.71
If GLD rallies and closes above the higher strike at expiration, $0.62 in credit is kept. A close below the lower strike costs $0.88. Breakeven is at $118.38.
Thanks for reading!
